
Superadmin Server Health Monitoring
Monitor the Open VTS server’s CPU, memory, disk usage, uptime, local service manager, and the health of essential platform services.
Last updated August 18, 2026
Superadmin Server Health Monitoring
The Server page provides a central health overview of the Windows server running Open VTS.
It helps the Superadmin verify:
- Current server resource usage
- Server uptime
- Local service-manager availability
- The operational state of essential Open VTS services
- Recommended recovery actions when a service is unhealthy
This page is primarily designed for monitoring server health. It does not replace operating-system-level administration, database management, log analysis, or infrastructure monitoring tools.
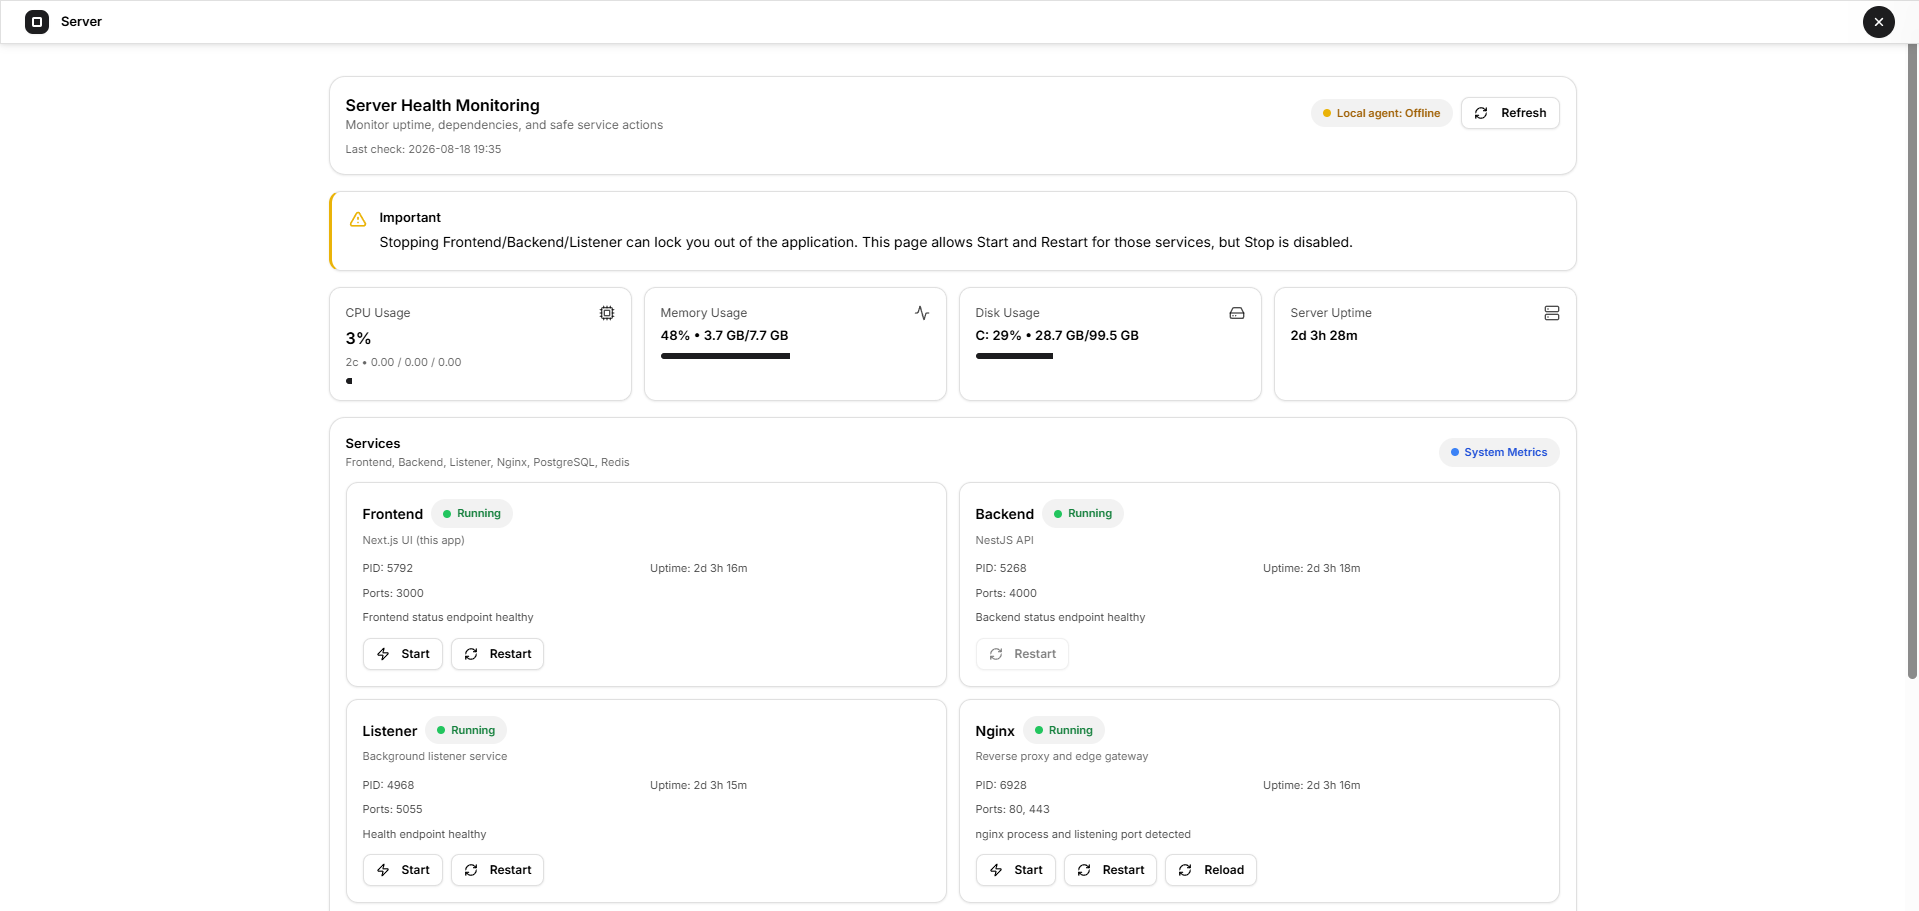
Server Health Header
The top section provides a quick summary of when the server was last checked.
It contains:
- Local agent status
- Refresh
- Last check time
Local Agent Status
The local service-manager agent helps Open VTS perform approved service actions on the server.
Its status can appear as:
- Local agent: Online
- Local agent: Offline
When the agent is offline, server metrics and service health may still be visible, but some service actions can become unavailable.
In particular, restarting the Backend requires the local agent to be online.
Refresh
Select Refresh to request the latest:
- CPU information
- Memory information
- Disk information
- Server uptime
- Service states
- Recommended actions
- Local agent status
The Last check value updates after the latest health request completes.
Important Safety Notice
The Server page includes a safety warning because stopping essential Open VTS services can make the application unavailable.
The interface allows limited Start, Restart, and Reload actions, but the Stop action is intentionally disabled.
This protects the Superadmin from accidentally stopping:
- Frontend
- Backend
- Listener
Stopping these services could prevent users from accessing Open VTS or receiving vehicle data.
System Health Metrics
The four summary cards show the current condition of the server.
CPU Usage
Shows the percentage of processor capacity currently being used.
The supporting information can include:
- Number of CPU cores
- One-minute load average
- Five-minute load average
- Fifteen-minute load average
A short temporary increase can be normal during:
- High vehicle-data traffic
- History or Replay processing
- Large exports
- Database operations
- Service restarts
Sustained high CPU usage should be investigated.
Memory Usage
Shows:
- Percentage of memory currently used
- Used memory
- Total available memory
Memory usage can increase as the number of connected vehicles, users, cached records, and background operations grows.
Consistently high memory usage may indicate that the server requires:
- More RAM
- Process investigation
- Application restart
- Workload optimization
Disk Usage
Shows the usage of the server’s primary storage drive.
The card displays:
- Drive name
- Percentage used
- Used storage
- Total storage
Disk space is especially important because Open VTS stores telemetry, logs, database records, exports, and application files.
Storage usage depends heavily on:
- Number of vehicles
- Device reporting interval
- Telemetry retention period
- Listener journaling
- Event storage
- Database maintenance
Do not allow the server drive to become completely full. Low disk space can affect database writes, telemetry storage, updates, and overall platform stability.
Server Uptime
Shows how long the Windows server has been running since its most recent restart.
A long uptime does not automatically mean that every Open VTS service has been running for the same duration. Each service card displays its own process uptime separately.
Services
The Services section monitors the essential components required by Open VTS.
The monitored services are:
- Frontend
- Backend
- Listener
- Nginx
- Redis
- PostgreSQL
Each service card can show:
- Current state
- Description
- Process ID
- Process uptime
- Monitored ports
- Health-check message
- Available recovery actions
Understanding Service States
Running
The required process, port, and health check were detected successfully.
A Running state indicates that the service appears operational at the time of the latest check.
Stopped
The expected process or listening port was not detected.
A stopped essential service can affect one or more Open VTS functions.
Degraded
The service was partially detected, but its complete health check did not pass.
Examples can include:
- Process running but health endpoint unavailable
- Port open but database health check failing
- Nginx process and listening ports not matching
- Redis or PostgreSQL connectivity failure
Unknown
Open VTS could not complete the verification.
This can happen when a required Windows monitoring command or system tool is unavailable.
Frontend
The Frontend provides the Open VTS web interface used by Superadmins, Administrators, and Users.
The monitored application port is:
3000
The service card checks:
- Whether the Frontend port is listening
- Whether the Frontend status endpoint responds
- Process ID
- Process uptime
If the Frontend is unavailable, users may not be able to open the Open VTS web application.
Available actions can include:
- Start
- Restart
Backend
The Backend provides the Open VTS API and application logic.
The monitored port is:
4000
The Backend supports operations such as:
- Authentication
- User and vehicle management
- Map data
- History and Replay requests
- Notifications
- Database operations
- Service APIs
The service card checks:
- Whether port 4000 is listening
- Whether the Backend status endpoint responds
- Process ID
- Process uptime
Restarting the Backend temporarily disconnects the current application session and requires the local service-manager agent to be online.
Available action:
- Restart
A confirmation is displayed before the Backend restart begins.
Listener
The Listener receives and processes communication from GPS devices.
Its monitored health or service ports can include:
5055 5005
These are health and service-monitoring ports. GPS devices may communicate through other configured listener ports according to their protocols.
If the Listener is stopped:
- GPS device packets may not be processed
- Live vehicle positions may stop updating
- Telemetry may not reach Redis or the database
- Commands may not reach connected devices
Available actions can include:
- Start
- Restart
Nginx
Nginx acts as the reverse proxy and web gateway for Open VTS.
The monitored ports are:
80 443
Nginx manages normal HTTP and secure HTTPS access to the application.
The health check verifies:
- Nginx process
- Port 80
- Port 443
A Degraded state can appear when the process and port state do not match.
Available actions can include:
- Start
- Restart
- Reload
Reload
Reload applies the current Nginx configuration without requiring the same full service restart process.
Use it after an approved configuration or SSL change.
Redis
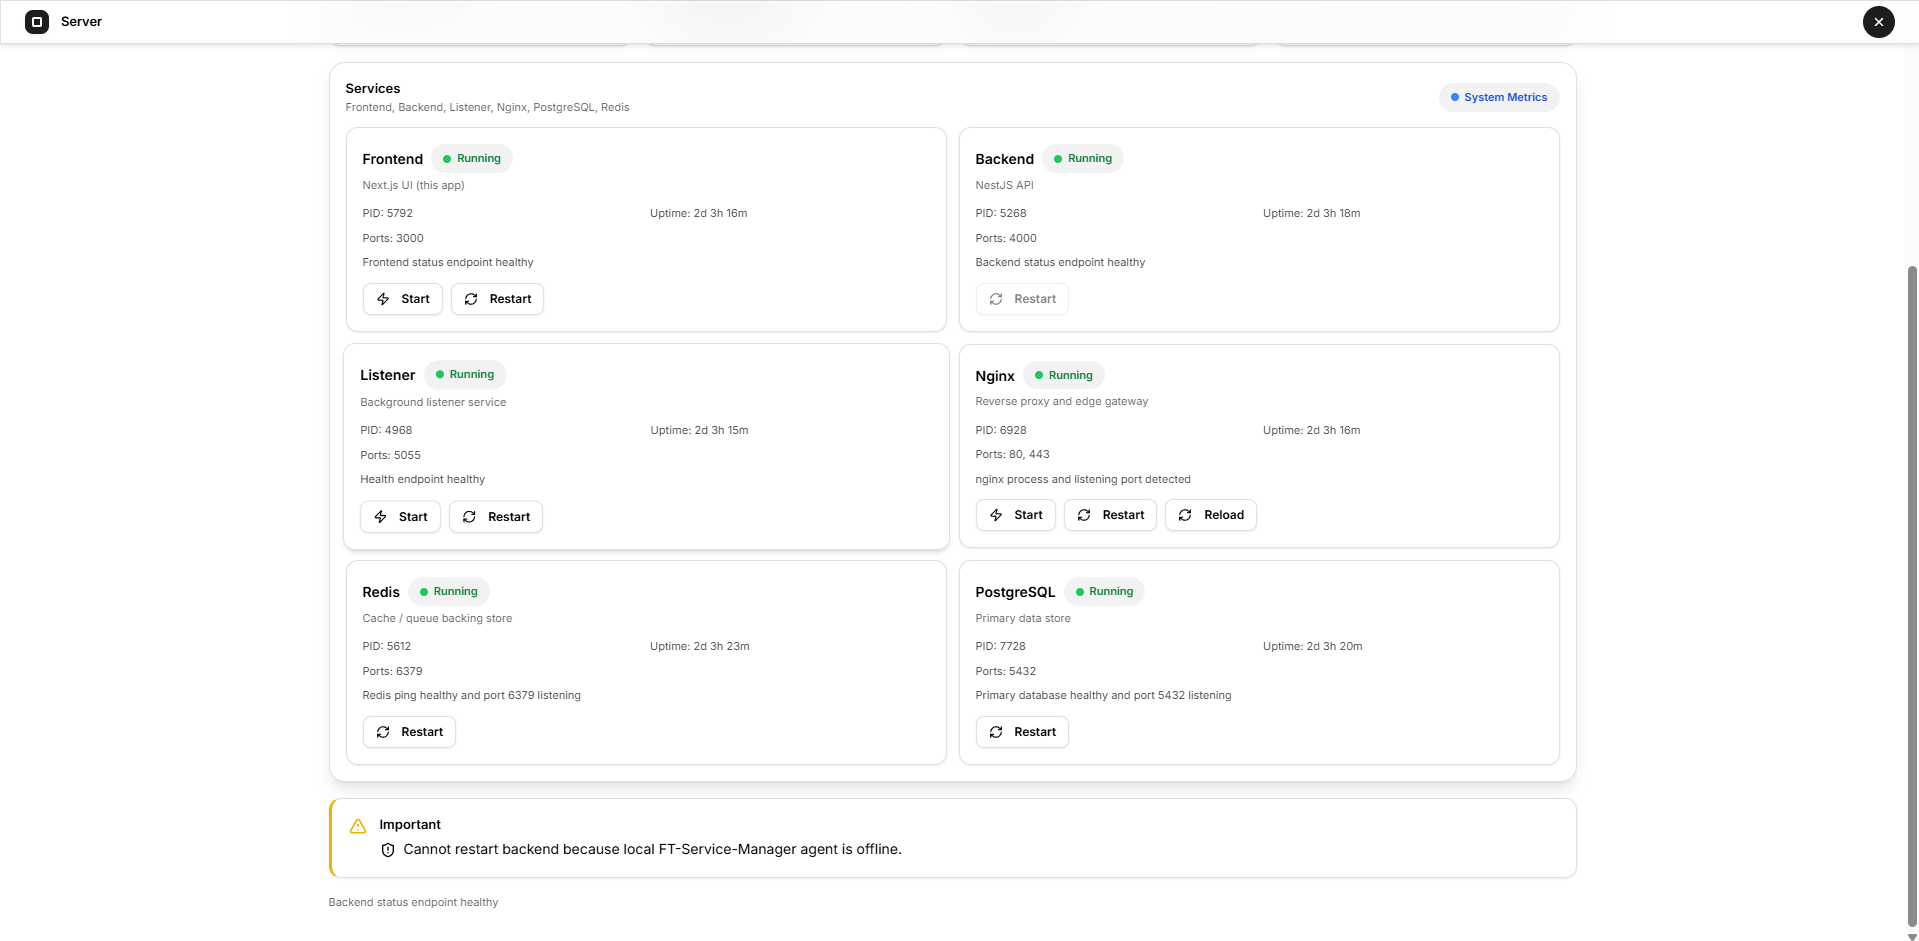
Redis provides fast in-memory storage used by Open VTS for live and temporary operational information.
The monitored port is:
6379
Redis can support:
- Live vehicle status
- Latest location information
- Device connection state
- Queues
- Caching
- Background processing
The health check verifies both:
- Redis connectivity
- Port 6379 availability
Available action:
- Restart
Redis port 6379 should remain private and must not be exposed publicly.
PostgreSQL
PostgreSQL is the primary relational database used by Open VTS.
The monitored port is:
5432
PostgreSQL stores important platform information such as:
- Accounts
- Vehicles
- Configuration
- Payments
- Events
- Telemetry-related records
- Platform settings
The health check verifies:
- Primary database connectivity
- Port 5432 availability
Available action:
- Restart
PostgreSQL port 5432 should remain private and blocked from the public internet.
Service Actions
The Server page provides limited recovery actions for approved services.
Start
Starts a service that is not currently running.
Start is available for:
- Frontend
- Listener
- Nginx
Restart
Stops and starts the selected service through the local service manager.
Restart is available for the monitored services, subject to system availability and safety restrictions.
Use Restart only when:
- The service is stopped or degraded
- Recommended Actions advises it
- The effect of restarting the service is understood
Reload
Reload is available only for Nginx.
Stop
Stop is disabled to reduce the risk of locking the Superadmin out of Open VTS.
Action Progress and Logs
When an allowed service action is started, Open VTS opens an action-status window.
It can display:
- Job status
- Job identifier
- Timestamped action logs
- Completed state
- Failed state
- Connection warnings
Possible job states include:
- Queued
- Running
- Completed
- Failed
After an action completes, the Server page refreshes the health information.
Recommended Actions
The Recommended Actions section appears when Open VTS detects a stopped or degraded service.
Recommendations can include:
- Restarting the Frontend
- Restarting the Backend
- Restarting the Listener
- Reloading Nginx and checking ports 80 and 443
- Restarting Redis and checking connectivity
- Restarting PostgreSQL and checking connectivity
Recommended Actions are generated from the current health checks. They do not mean that the action has already been performed.
Review the service state and warning messages before taking action.
Reviewing Server Health
Use the following workflow for a routine server check:
- Open Server from the Superadmin home page.
- Select Refresh.
- Confirm whether the local agent is Online.
- Review CPU, memory, disk, and server uptime.
- Confirm that all essential services show Running.
- Read the health message shown on any stopped, degraded, or unknown service.
- Review Recommended Actions.
- Use an approved Start, Restart, or Reload action only when necessary.
- Refresh the page again and confirm that the service has returned to Running.
Important Service Dependencies
The services work together and should not be treated as isolated components.
- Nginx provides public web access.
- Frontend displays the application.
- Backend provides APIs and platform logic.
- Listener receives GPS device communication.
- Redis supports live data and background processing.
- PostgreSQL stores persistent platform data.
A service can appear Running while another dependency is unhealthy.
For example:
- Frontend may be running while Backend is unavailable.
- Backend may be running while PostgreSQL is degraded.
- The web application may open while the Listener is stopped.
- Vehicle records may remain visible while new live telemetry is no longer arriving.
Review all service cards together when investigating platform health.
Empty and Error States
Health Data Cannot Be Loaded
An error message appears when Open VTS cannot retrieve the server overview.
Select Refresh to try again.
Unknown Service State
Unknown means the server could not complete the required process or port verification.
Check that the required Windows system tools and permissions are available.
Local Agent Offline
When the local agent is offline:
- Some service operations are unavailable
- Backend restart is disabled
- A warning appears at the bottom of the page
The local service manager should be checked directly on the Windows server.
Missing Metric
A dash appears when a system or service metric cannot be obtained.
Important Limitations
The Server page is not intended to provide:
- Complete Windows Event Viewer logs
- Database table sizes
- PostgreSQL query performance
- Redis memory analysis
- Network bandwidth graphs
- GPS packet throughput charts
- Historical CPU or memory charts
- Cloud billing information
- Firewall management
- Server updates
- Database backup and restore
- Operating-system restart or shutdown
Use the appropriate server, database, cloud, or operating-system tools for these activities.
Security and Privacy
Server screenshots can expose sensitive infrastructure information.
Before publishing screenshots or recordings, hide or replace:
- Server hostname
- Public IP address
- Internal IP address
- Process IDs
- Installation paths
- Database details
- Internal error messages
- Service action job IDs
- Environment variables
- Customer information
Ports 4000, 5432, and 6379 should remain private and blocked from public access.
Only the required web and GPS device communication ports should be exposed.
Next Step
Continue to Superadmin Support to review support tickets, requests, and communication associated with the platform.