
Admin Logs
The Logs section gives administrators a centralized view of account activity, vehicle-generated events, and raw telemetry data. It is designed for auditing, troubleshooting, and understanding what is happening across the fleet.
Last updated August 19, 2026
Admin Logs
The Logs section brings three important types of records together in one place:
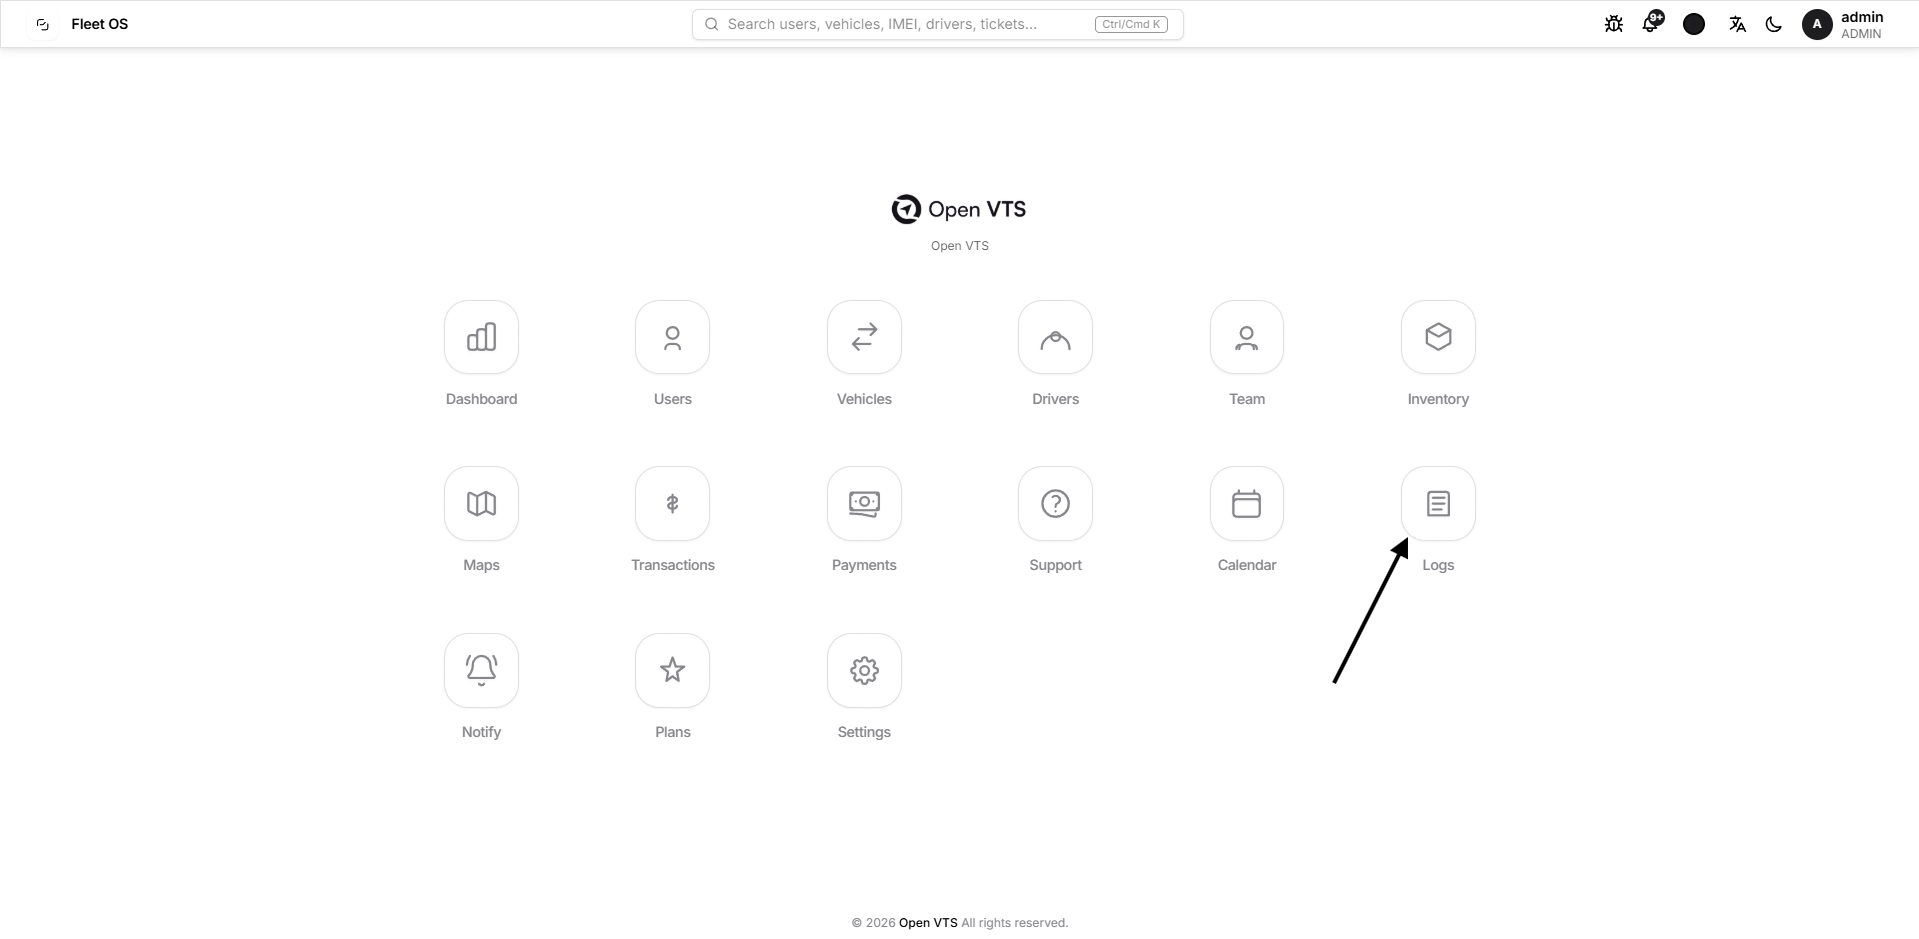
- Activity Logs — records actions performed within the platform.
- Vehicle Events — shows events generated by vehicles and notification workflows.
- Telemetry Logs — displays raw telemetry received from GPS devices.
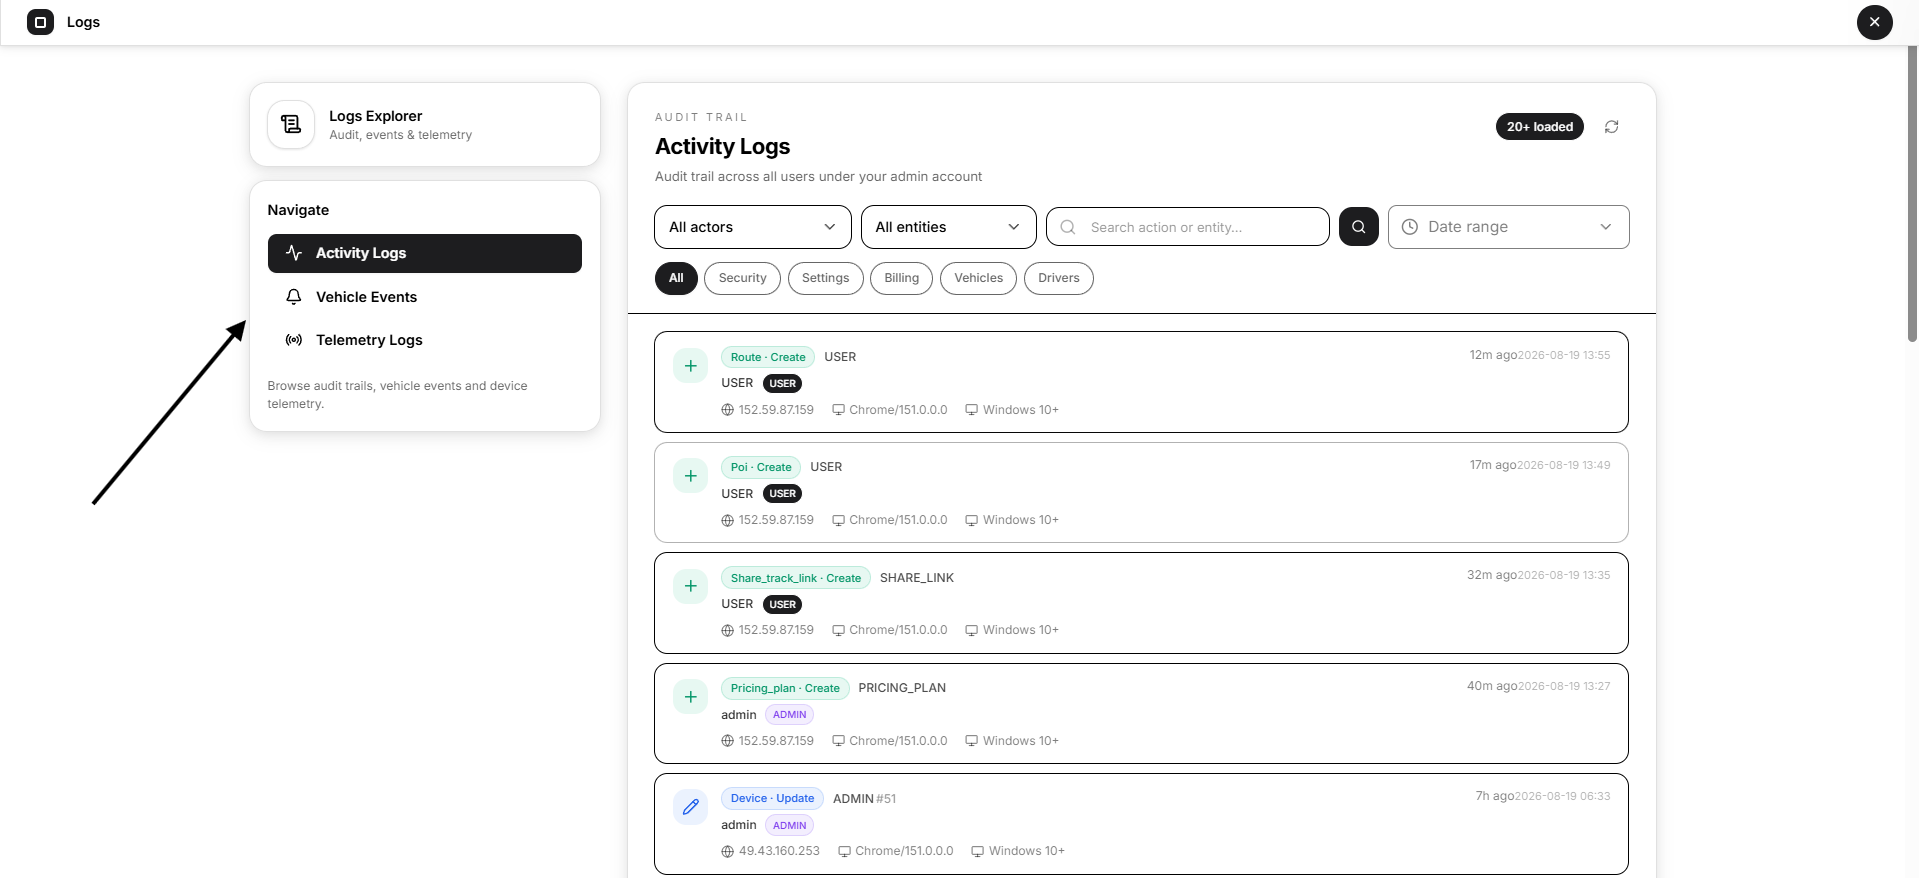
Use the navigation menu on the left to move between these log types.
Activity Logs
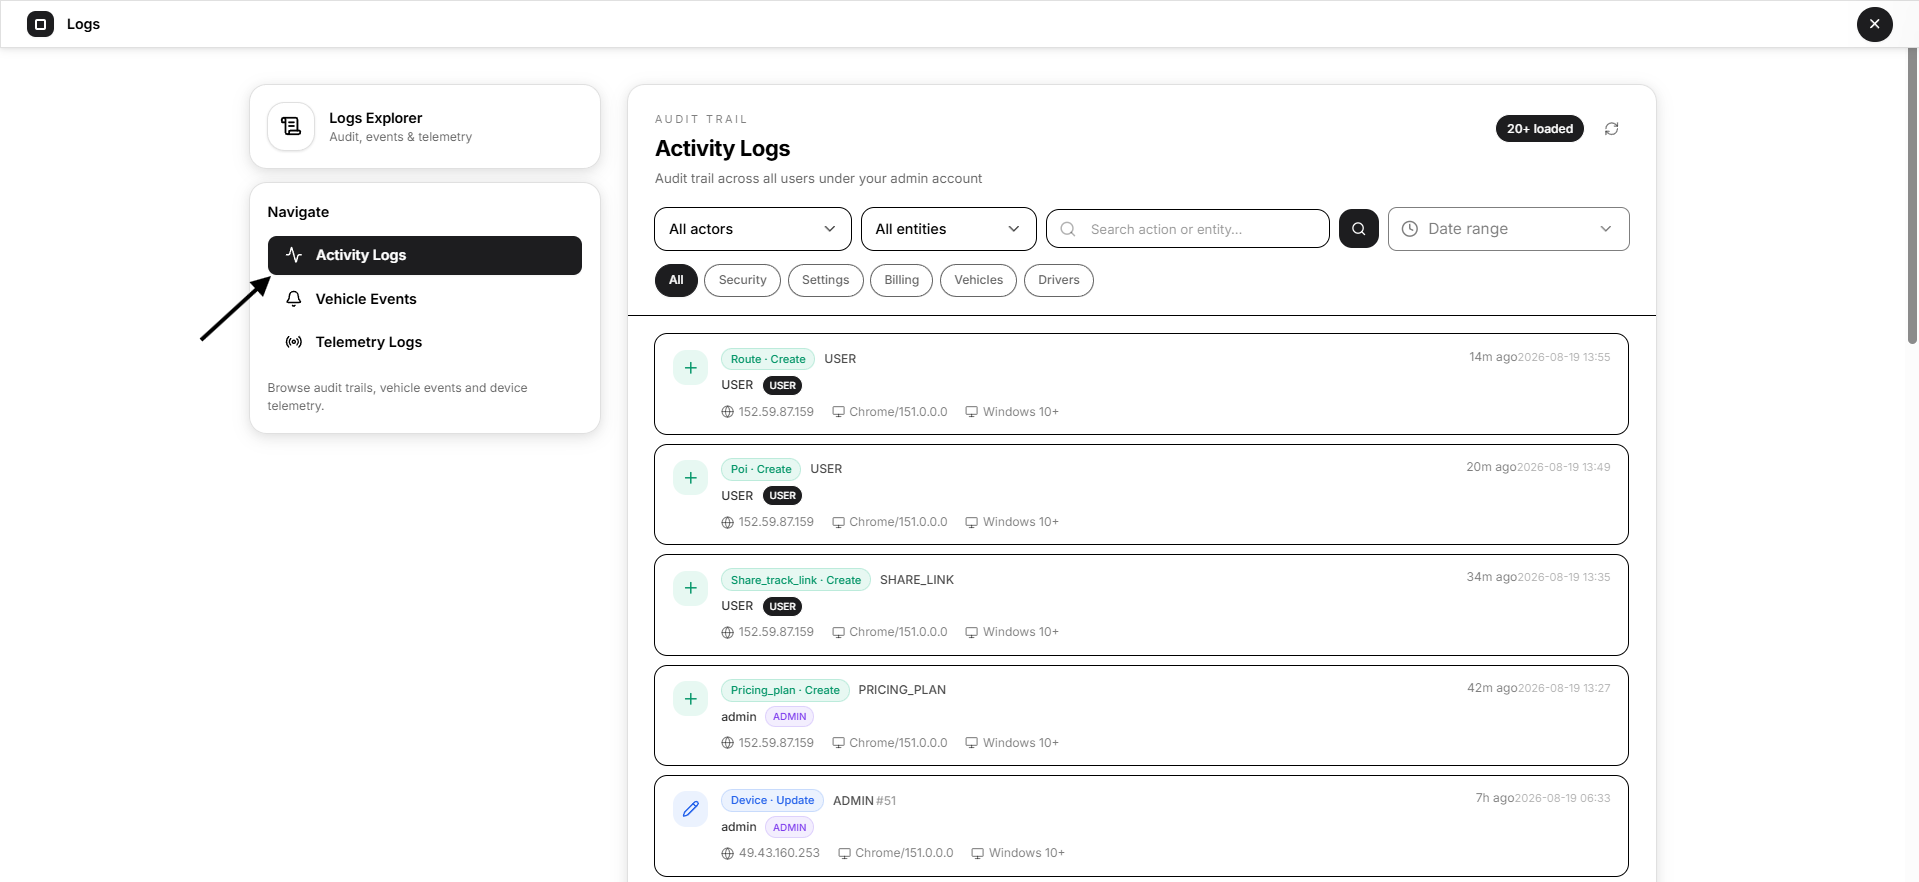
Activity Logs provide an audit trail of actions performed across the administrator account.
Each entry can show information such as:
- Action performed
- Entity involved
- User or administrator who performed the action
- IP address
- Browser
- Platform
- Date and time
Examples can include actions such as creating, updating, or deleting records.
Filtering Activity Logs
You can narrow the results using:
- Actor
- Entity
- Search
- Date range
- Category filters such as Security, Settings, Billing, Vehicles, and Drivers
Select the refresh icon to reload the latest activity.
Activity Log Details
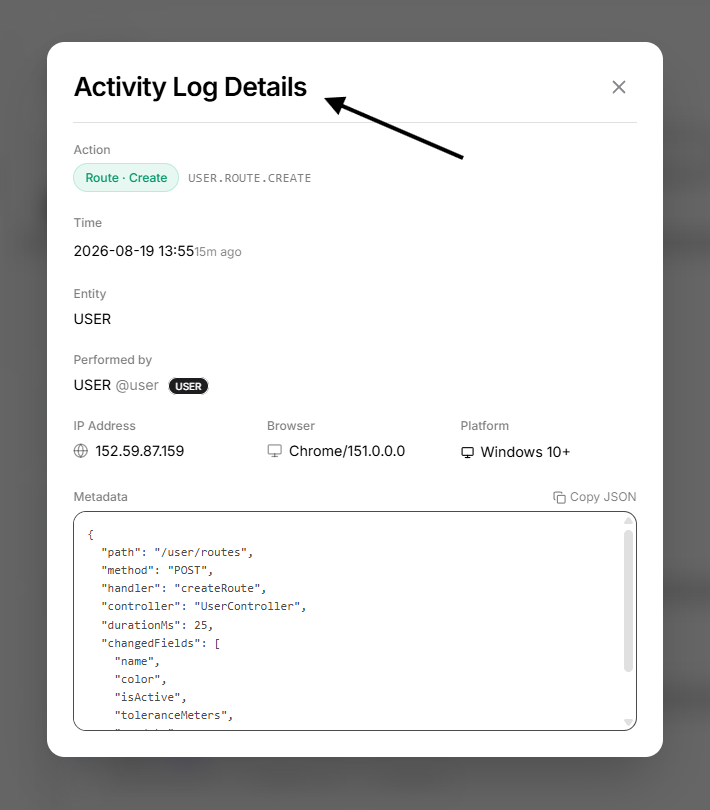
Select an activity record to open Activity Log Details.
The details panel provides a deeper view of the selected action, including:
- Action
- Time
- Entity
- Performed by
- IP address
- Browser
- Platform
- Metadata
The Metadata section contains additional technical information related to the action and can be copied as JSON when required.
This view is especially useful when auditing administrative changes or investigating how a record was modified.
Vehicle Event Logs
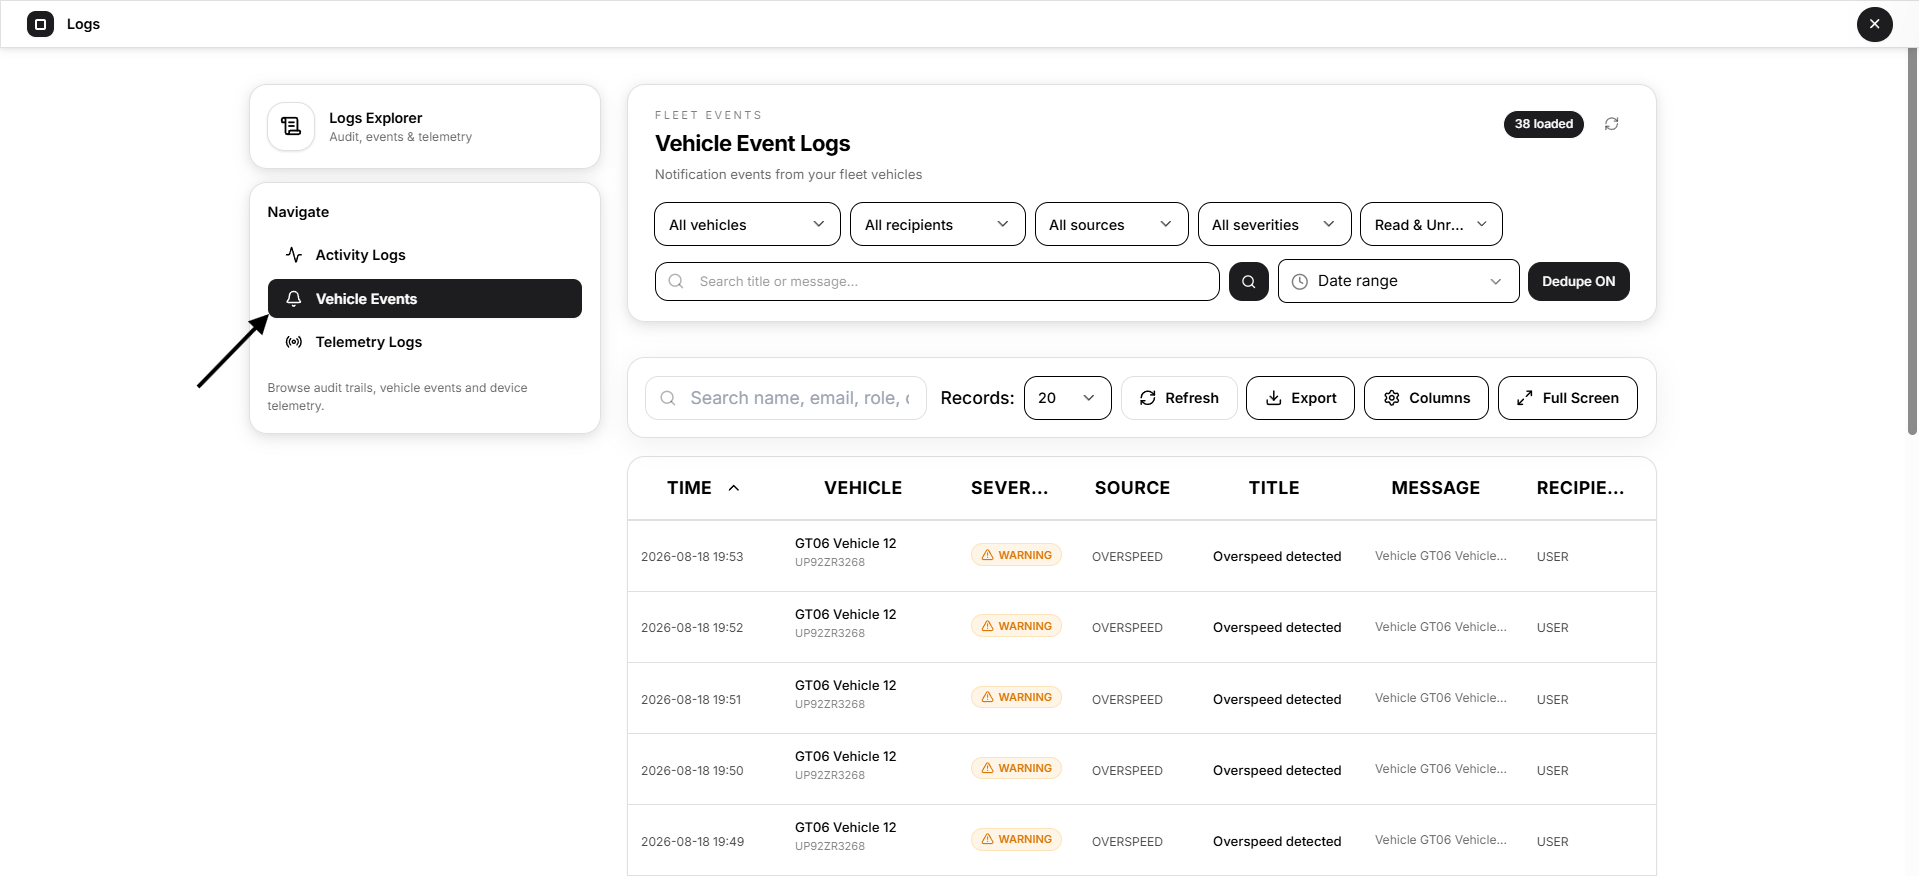
Vehicle Event Logs show events generated from fleet activity.
Typical events can include:
- Overspeed
- Geofence activity
- Ignition events
- Route-related events
- Reminders
- Other configured vehicle events
Each row can show:
- Time
- Vehicle
- Severity
- Source
- Title
- Message
- Recipient
Filter Vehicle Events
Use the available filters to narrow the event list by:
- Vehicle
- Recipient
- Source
- Severity
- Read or unread status
- Date range
- Search text
The Dedupe option can be used to reduce repeated event entries when applicable.
Event Details
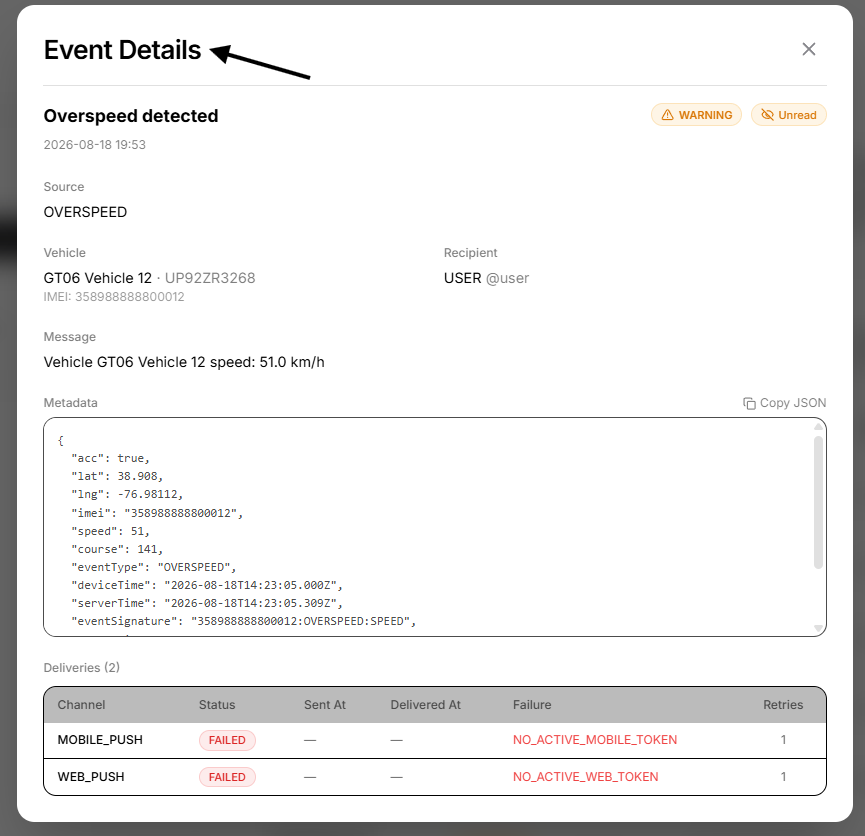
Select an event to open its Event Details.
The panel can display:
- Event title
- Event time
- Severity
- Read or unread state
- Source
- Vehicle
- Recipient
- Message
- Metadata
The metadata section contains the event payload and additional values captured when the event was generated.
Delivery Information
When notifications are associated with the event, Open VTS also shows delivery information such as:
- Channel
- Delivery status
- Sent time
- Delivered time
- Failure reason
- Retry count
This makes it easier to determine whether a notification was successfully delivered or why it failed.
Telemetry Logs
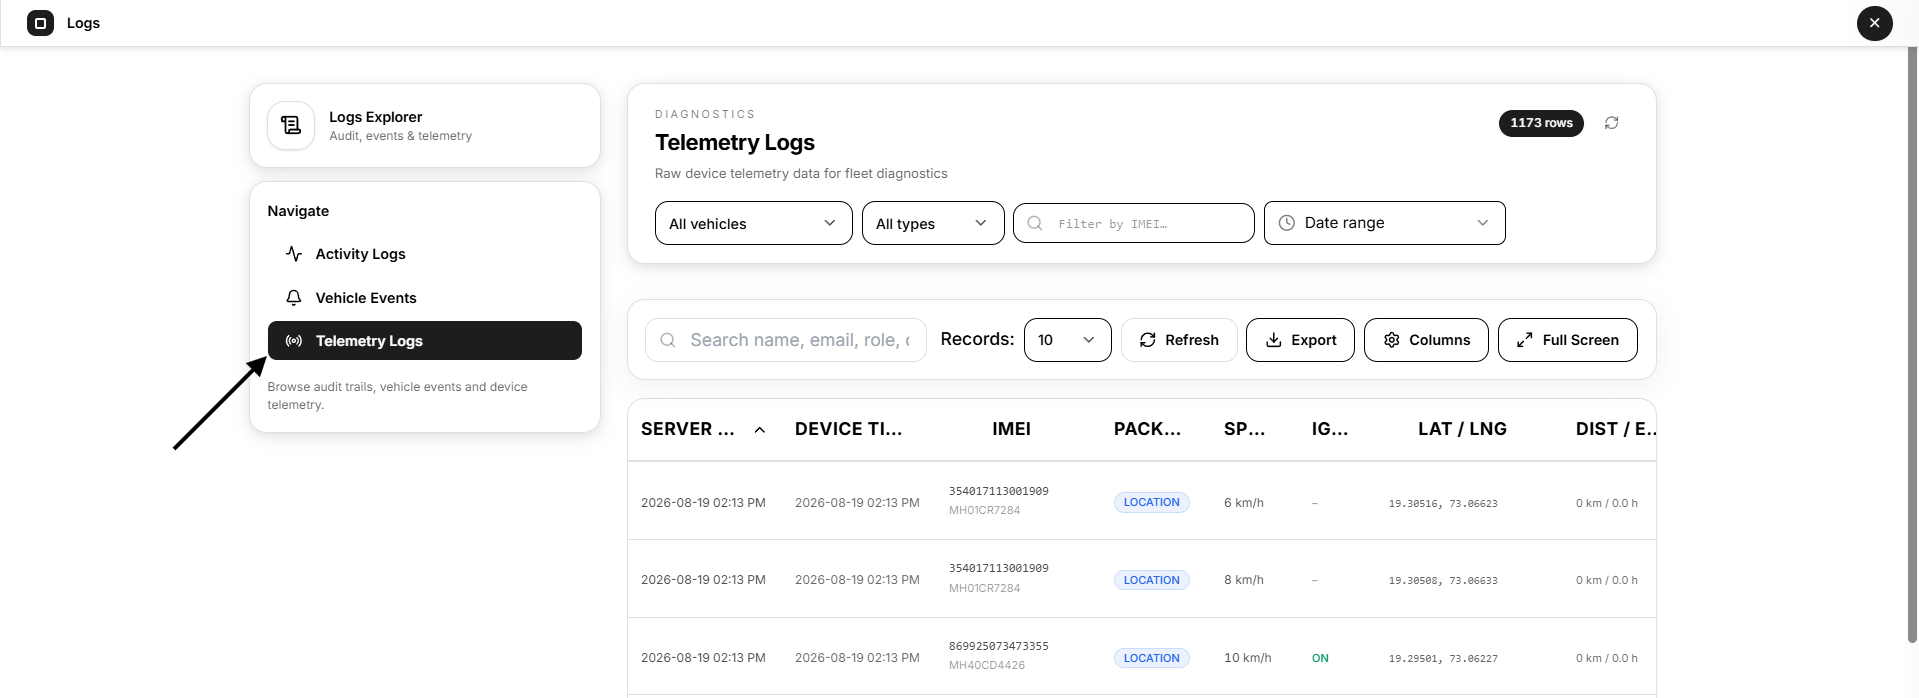
Telemetry Logs provide the raw device data received from fleet vehicles.
This section is mainly useful for:
- Device diagnostics
- Data verification
- Protocol troubleshooting
- Checking GPS communication
- Inspecting incoming vehicle values
The table can show data such as:
- Server time
- Device time
- IMEI
- Packet type
- Speed
- Ignition
- Latitude and longitude
- Distance
- Engine hours
- Other telemetry fields
Filter Telemetry Logs
Telemetry records can be filtered by:
- Vehicle
- Packet type
- IMEI
- Date range
Use these filters when you need to inspect data from a specific device or time period.
Telemetry Log Details
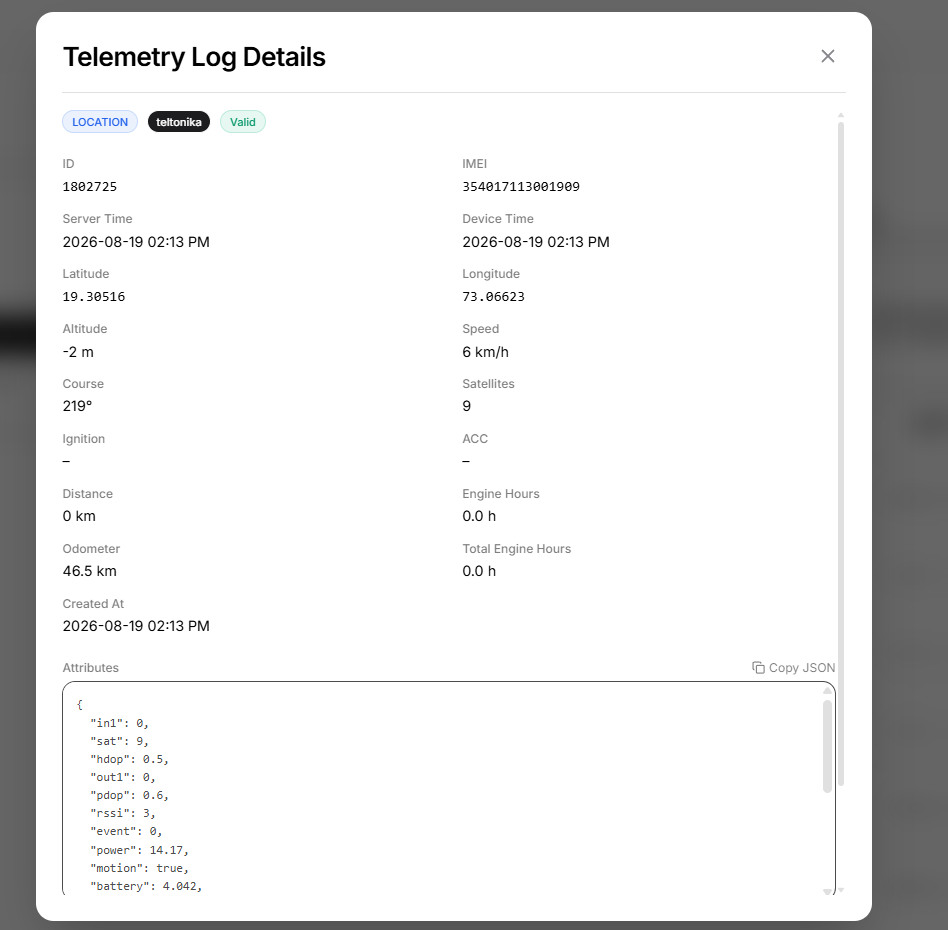
Select a telemetry record to open Telemetry Log Details.
Depending on the received packet, the detail view may include:
- IMEI
- Server time
- Device time
- Latitude
- Longitude
- Altitude
- Speed
- Course
- Satellites
- Ignition
- ACC
- Distance
- Engine hours
- Odometer
- Total engine hours
- Created time
Attributes
The Attributes section displays additional telemetry values contained in the device packet.
These values are shown in structured JSON and can be copied when needed.
Raw Data
Where available, the original raw telemetry information can also be reviewed for deeper diagnostics.
Table Controls
Vehicle Events and Telemetry Logs include standard table controls to make larger datasets easier to work with.
You can use:
- Search — locate specific records.
- Records — choose how many entries are displayed.
- Refresh — reload the latest data.
- Export — export records when required.
- Columns — choose which table columns are visible.
- Full Screen — expand the table for easier review.
When to Use Each Log
Activity Logs Use these when you want to know who changed something in Open VTS and when.
Vehicle Event Logs Use these when you want to understand what event occurred for a vehicle and whether related notifications were delivered.
Telemetry Logs Use these when you need to inspect the actual GPS data received from a device.
Key Takeaway
The Logs section acts as the operational history of Open VTS. Activity Logs explain platform actions, Vehicle Event Logs explain fleet events, and Telemetry Logs provide the underlying GPS data used for diagnostics and verification.