
Superadmin Map: Complete Fleet Tracking Guide
Learn how to use the Open VTS Superadmin Map for live fleet monitoring, vehicle search, telemetry review, trip history, replay, logs, commands, alerts, events, geofences, POIs, saved routes, and map customization.
Last updated August 18, 2026
Superadmin Map: Complete Fleet Tracking Guide
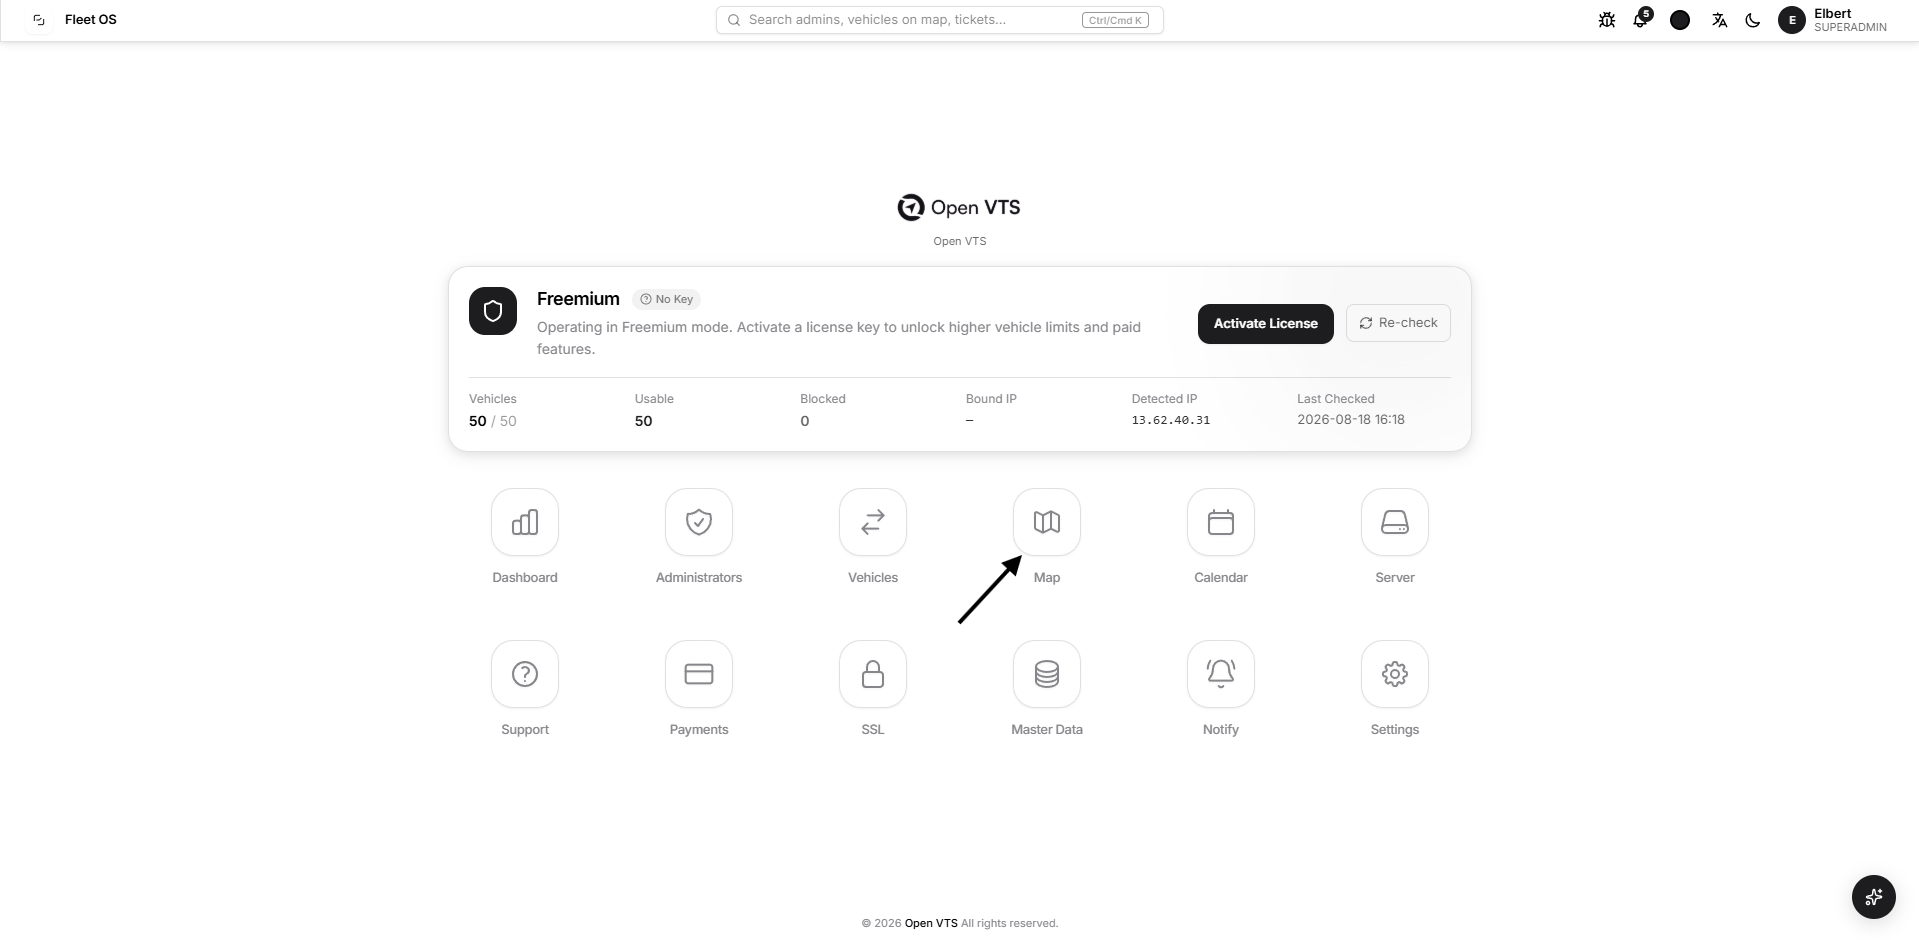
The Superadmin Map is the central live-tracking and fleet-analysis workspace in Open VTS.
It gives the Superadmin platform-wide visibility of vehicles created across all Administrators. From one screen, the Superadmin can monitor current vehicle positions, search and filter vehicles, inspect telemetry, review historical movement, replay journeys, examine raw logs, send device commands, monitor alerts, and display operational overlays such as geofences, Points of Interest, and saved routes.
The Map combines three types of information:
- Live information: Latest telemetry received from GPS devices
- Historical information: Stored telemetry used for Logs, Replay, and Trip History
- Operational information: Vehicle records, alerts, geofences, POIs, saved routes, licensing, and device commands
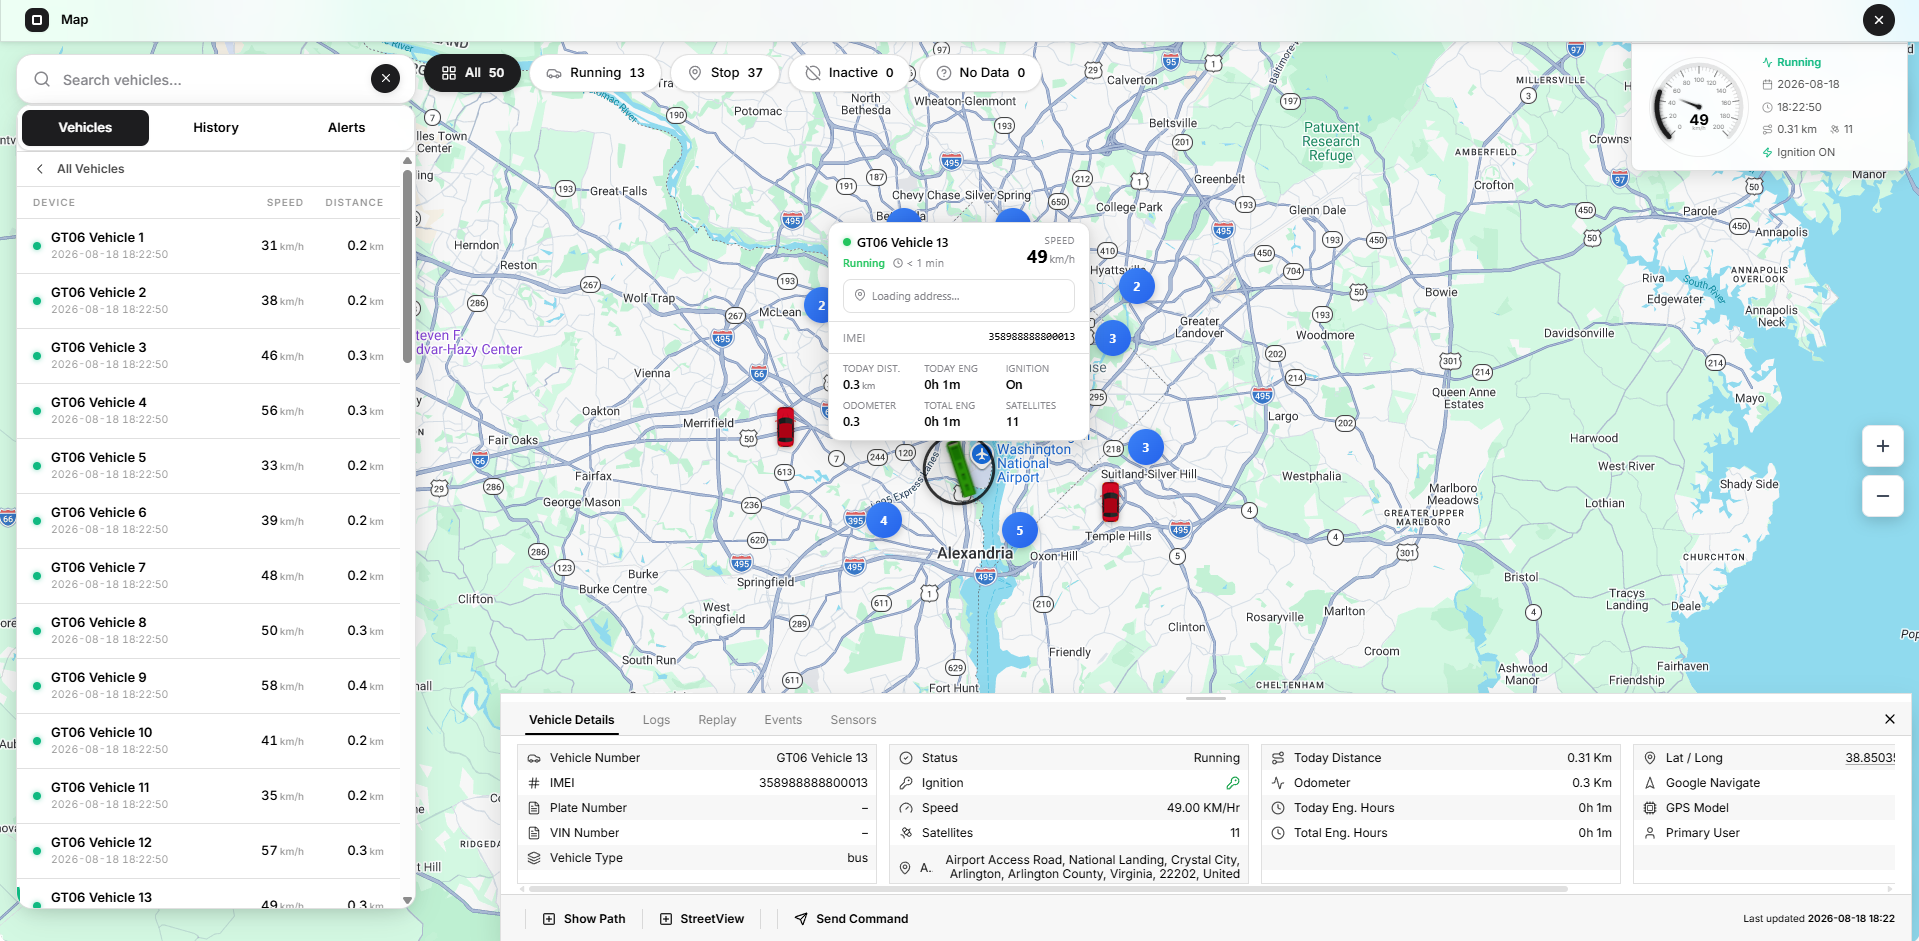
Understanding the Map Workspace
The Map workspace contains four main areas:
- Top controls: Search and vehicle-status filters
- Left panel: Vehicles, History, and Alerts
- Map canvas: Vehicle markers, routes, overlays, and geographic context
- Vehicle workspace: Live summary and bottom Vehicle Details panel
The Map opens in the current two-dimensional map mode. The platform contains shared support for other renderers, but the 2D/3D switch is not currently available in the Superadmin interface.
Select the X in the upper-right corner to close the Map.
How Vehicle Data Reaches the Map
Open VTS first loads vehicle and telemetry information from the server. For large fleets, this data is loaded progressively in pages rather than requiring every record to arrive before the Map becomes usable.
After the initial data is loaded, live socket updates apply only to vehicles whose telemetry has changed. This avoids rebuilding the complete Map whenever one device sends a new packet.
The Map therefore combines:
- Progressive server loading
- Live telemetry updates
- Device-status updates
- Periodic status recalculation
- Incremental marker movement
When thousands of vehicles exist, counts and markers may appear progressively while additional pages are still loading. This is expected during the initial load.
Only vehicles with valid latitude and longitude values can appear as markers. A vehicle may therefore exist in the vehicle list even when no marker can be drawn.
Search Vehicles
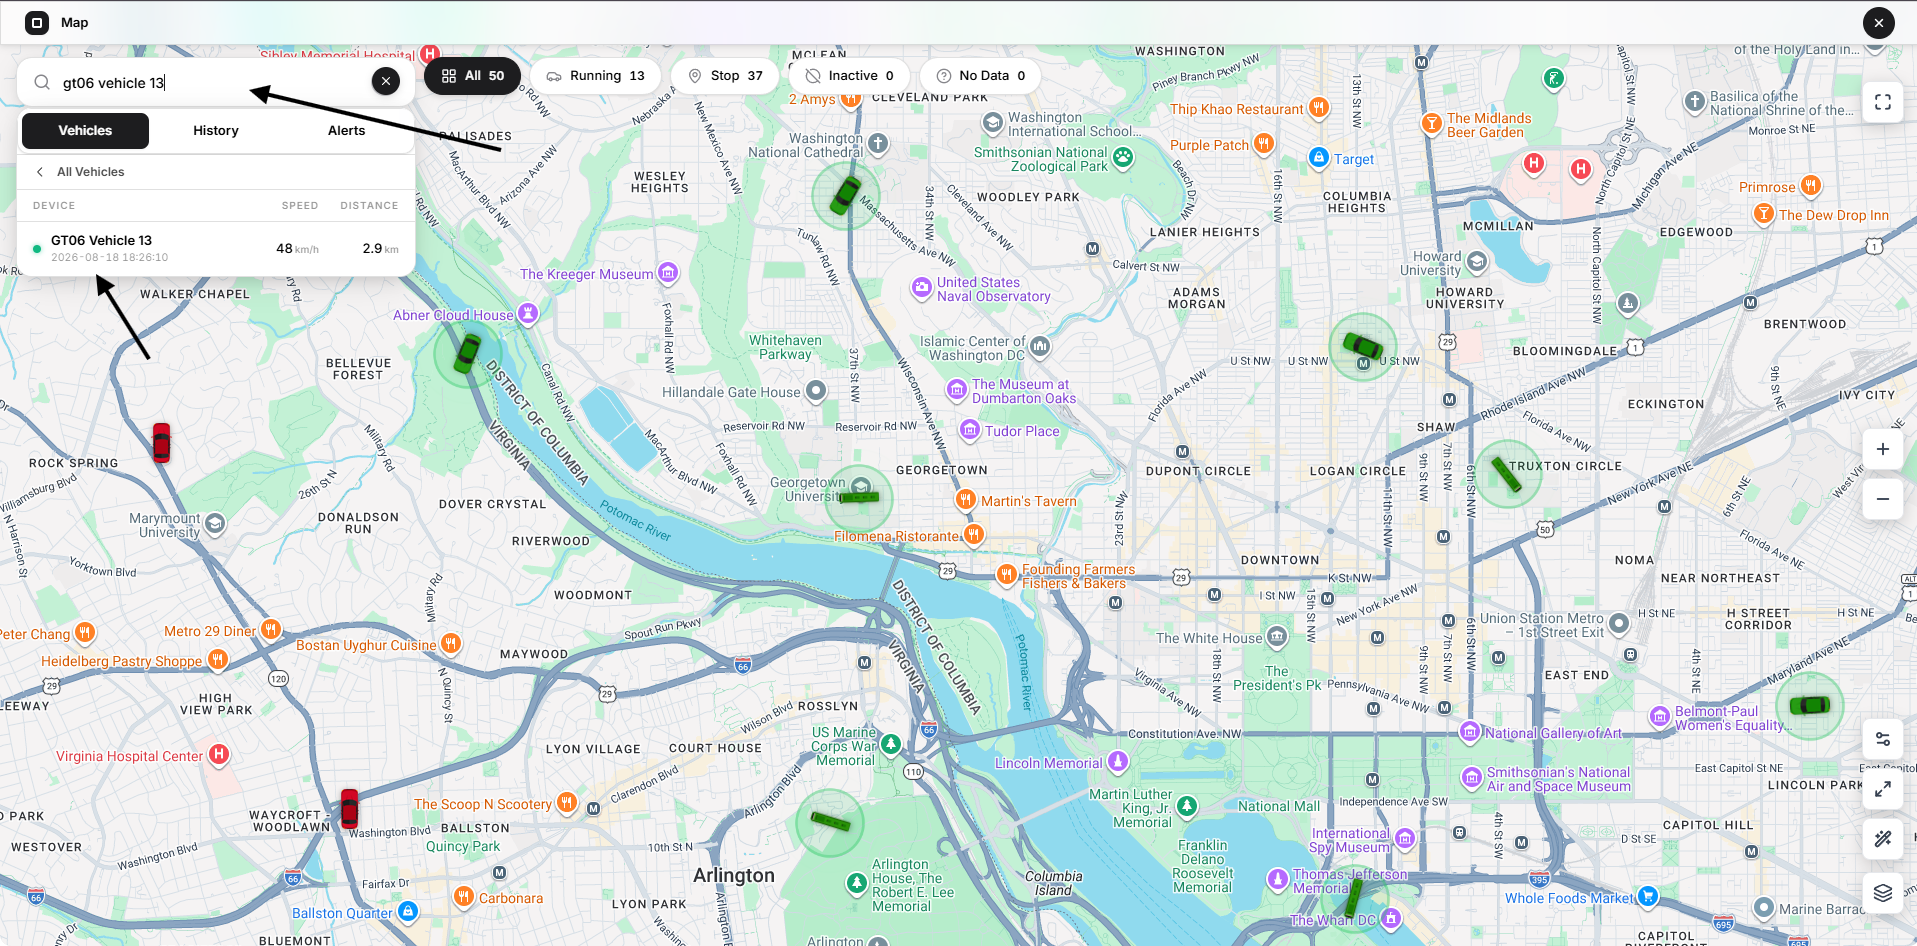
Use Search vehicles to find a vehicle using:
- Vehicle name or number
- IMEI
The search filters the visible vehicle list as you type.
Select the X inside the search field to clear the query.
The search field remains visible across the Vehicles, History, and Alerts tabs. Its behaviour depends on the active tab:
- In Vehicles, it filters vehicle name and IMEI.
- In Alerts, it can filter alert title, vehicle name, or IMEI.
- In History, use the separate vehicle selector inside the History panel.
The location-style icon shown when the search field is empty does not currently perform an active function and is not part of the documented workflow.
Vehicle Status Filters
The status controls at the top of the Map show the number of vehicles in each available category.
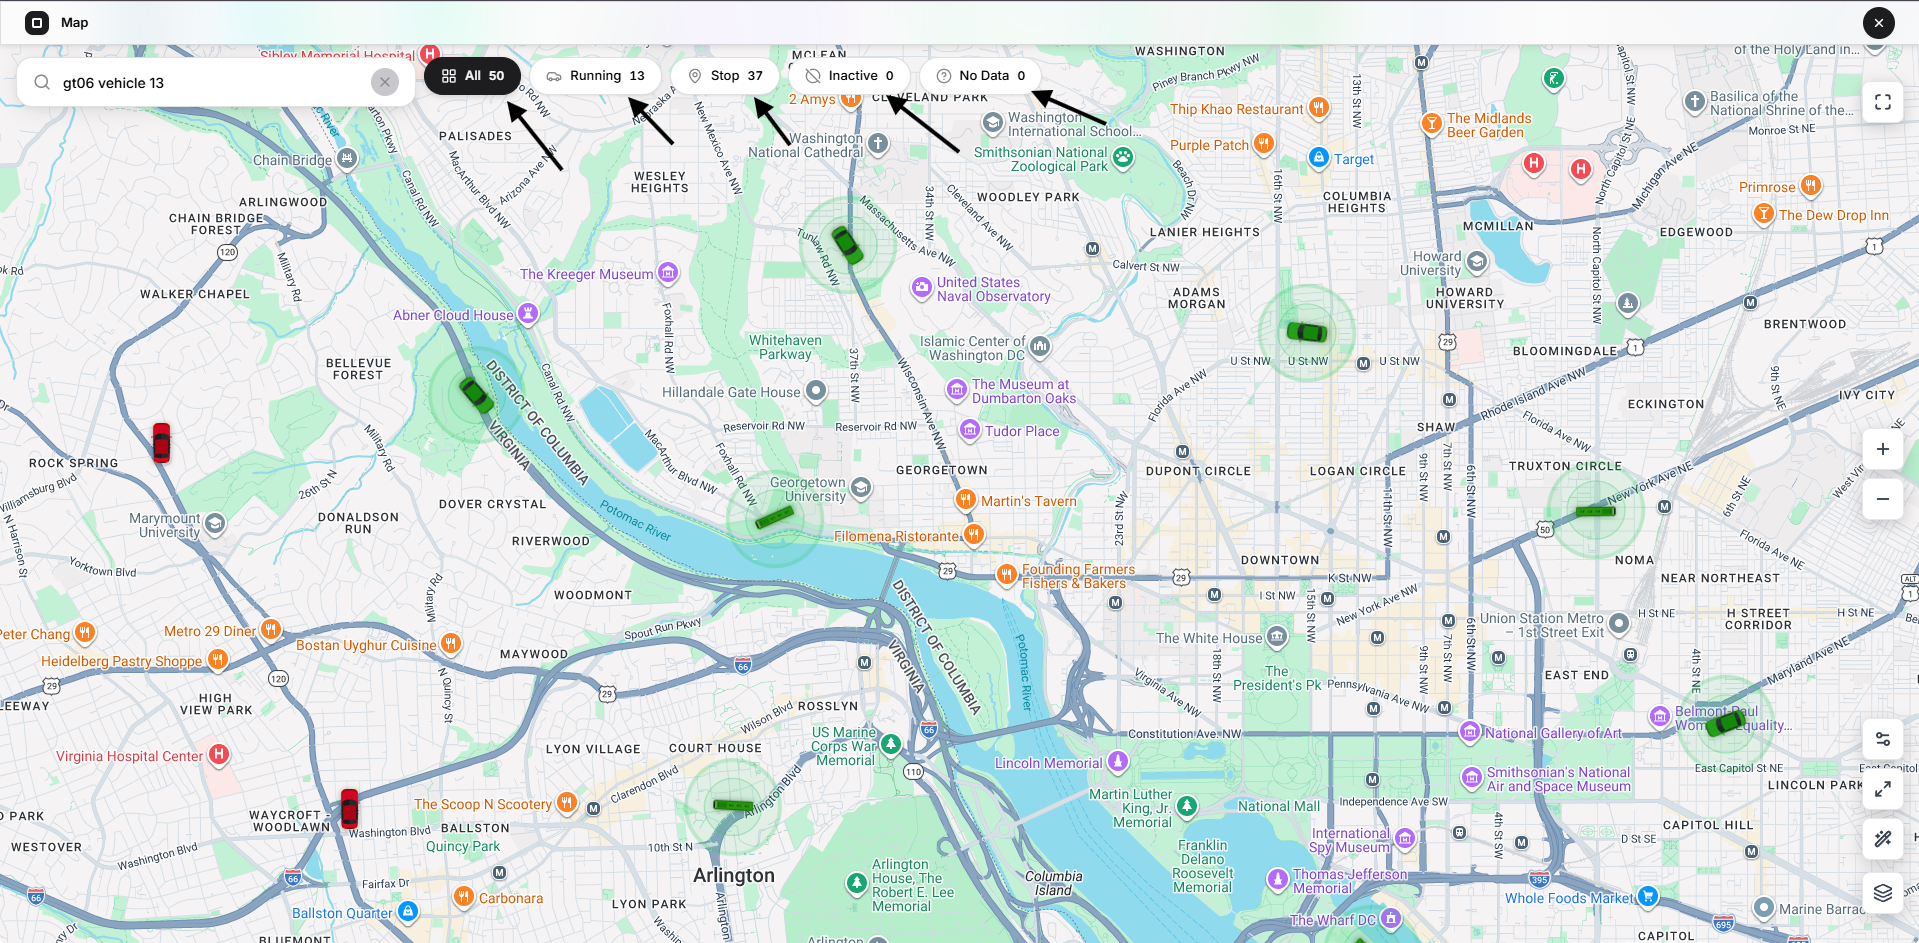
The current filters are:
- All
- Running
- Stop
- Inactive
- No Data
Selecting a status filters the vehicle list and returns the left panel to the Vehicles tab.
All
Shows all vehicle records currently available to the Superadmin.
The All count can be greater than the number of visible markers because vehicles without valid coordinates cannot be drawn on the Map.
Running
A vehicle is classified as Running when its latest telemetry is recent and its speed is above the movement threshold.
In the current status calculation:
- Telemetry must be less than approximately two minutes old.
- Speed must be above 3 km/h.
A short debounce is used when speed drops so that a brief zero-speed packet does not cause the marker to switch state immediately.
Stop
A vehicle is classified as Stop when:
- Recent telemetry reports a speed of 3 km/h or below, or
- No fresh packet has been received for approximately two minutes, but the latest telemetry is less than 48 hours old
Inactive
A vehicle is classified as Inactive when no usable telemetry time exists or the last available telemetry is approximately 48 hours old or older.
No Data
No Data is a separate platform filter for records without usable tracking information.
No Data and Inactive markers use the same inactive visual style on the Map.
Marker Colours
The Map uses a simple three-state marker system:
- Green: Running
- Red: Stopped
- White or light grey: Inactive or no usable live data
Licensing and account restrictions are communicated through list badges and the vehicle panel rather than using the normal live marker colours.
The vehicle icon can reflect the configured vehicle type, such as a car, bus, or truck.
The marker direction follows the latest available course value when a valid course is present.
Vehicles Tab
The Vehicles tab provides a scrollable list of vehicles across the platform.
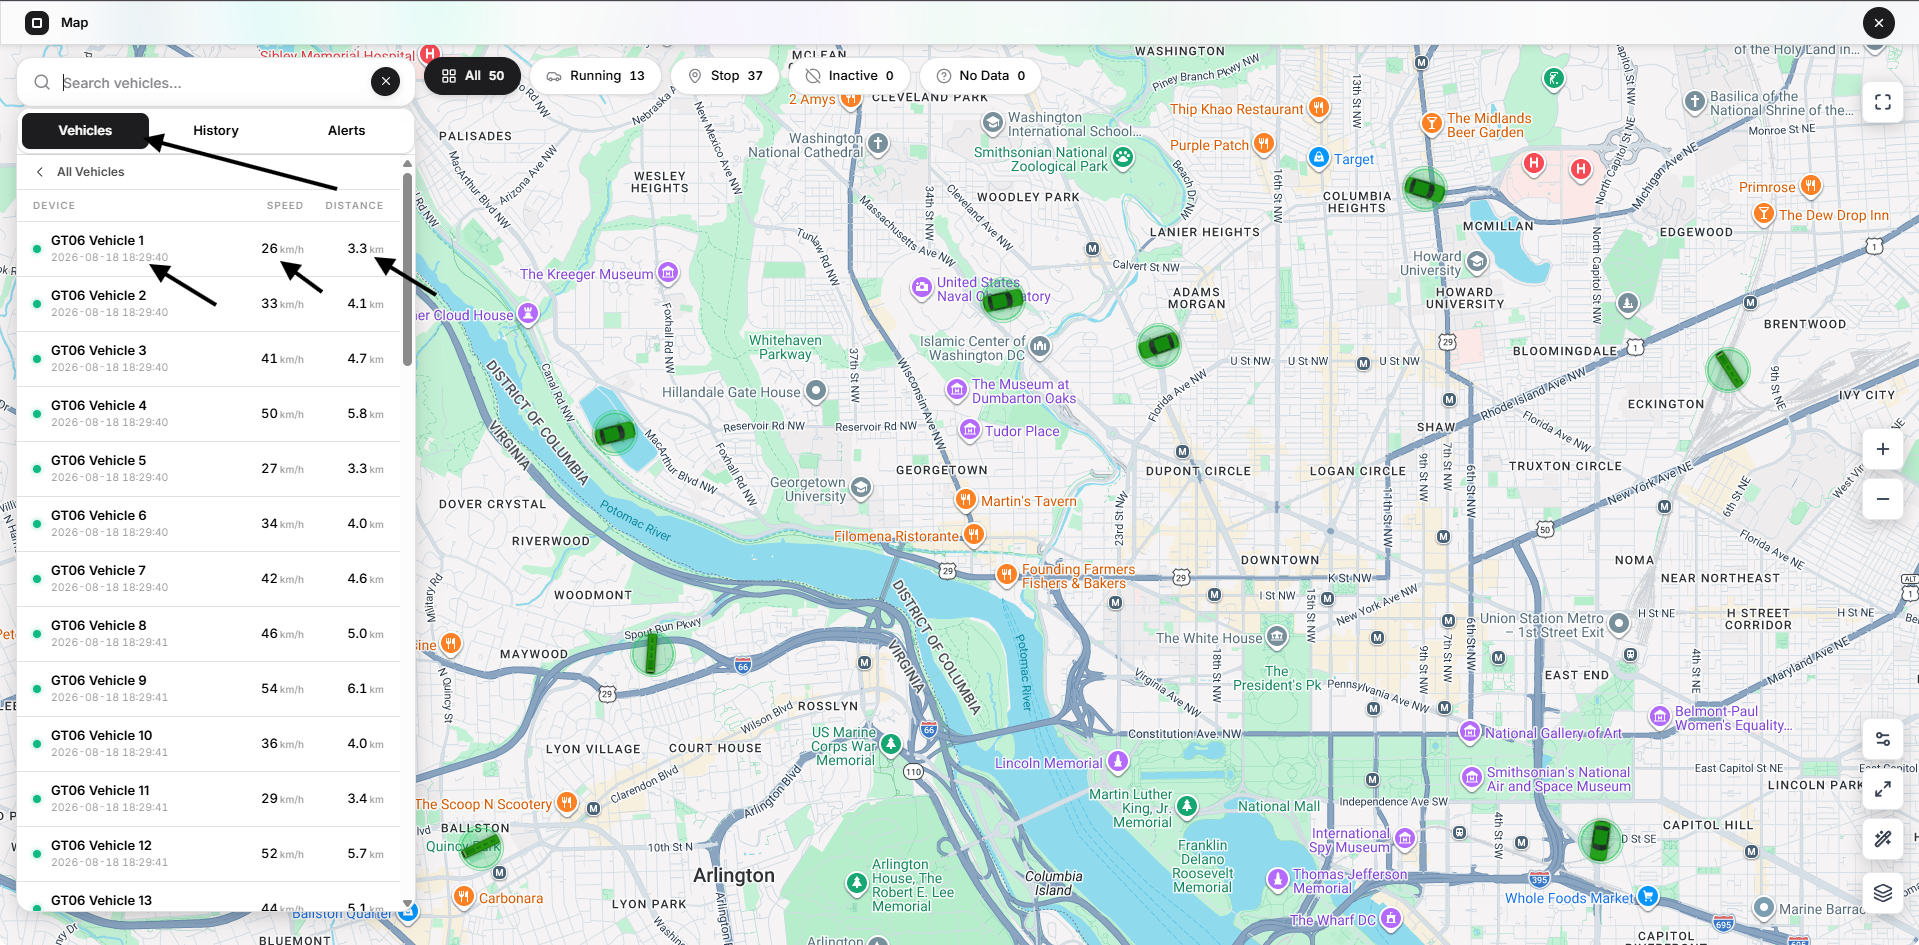
Each row contains:
- Status indicator
- Vehicle name or number
- Last update time
- Current speed
- Today’s distance
- Licensing warning, when applicable
Device
The Device column shows the vehicle name or number and its latest update time.
For a vehicle without tracking data, the row can display a not-connected state instead of a telemetry timestamp.
Speed
Shows the latest effective speed in kilometres per hour.
When telemetry becomes stale, Open VTS presents the effective live speed as zero.
Distance
Shows the distance recorded for the current day.
A dash appears when the value is unavailable.
All Vehicles
Select All Vehicles above the list to:
- Clear the selected vehicle
- Close the bottom Vehicle Details panel
- Return the Map to a view containing all available vehicle markers
Vehicle Quick View
Hover over a vehicle row or a vehicle marker to open the shared Vehicle Quick View.
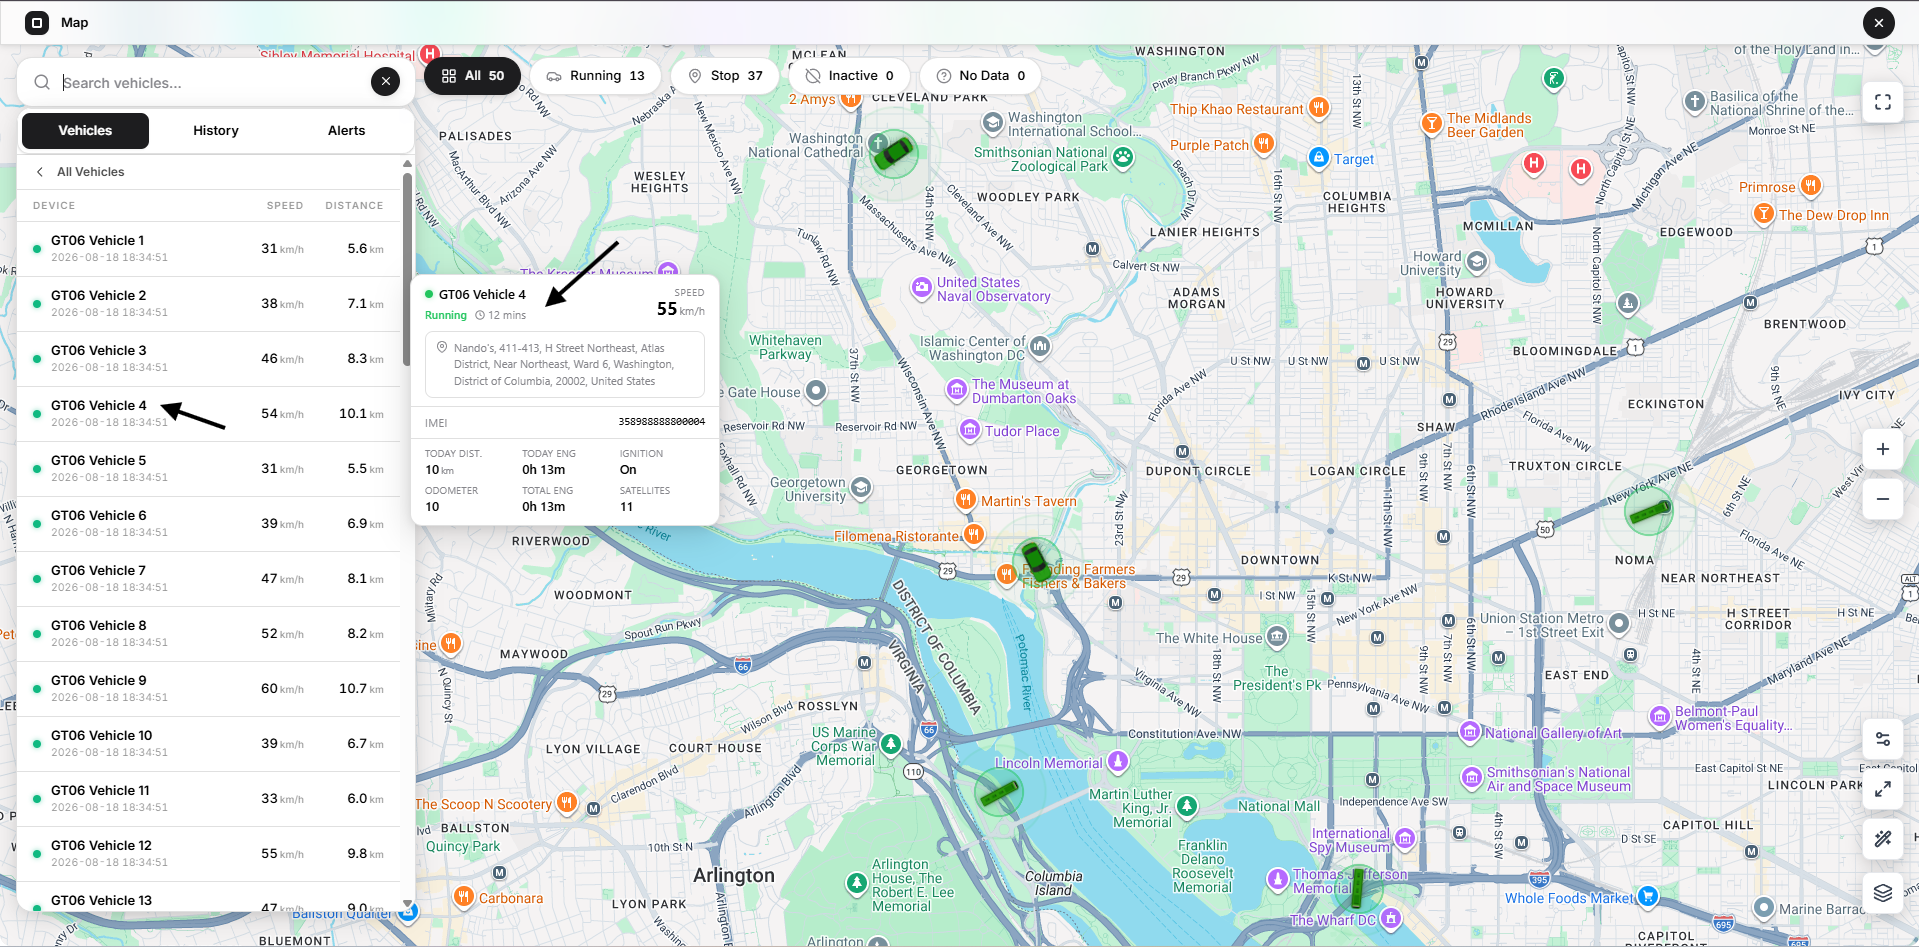
Both hover locations use the same information structure.
The Quick View can show:
- Vehicle name or number
- Running or stopped state
- Time spent in the current state
- Current speed
- Resolved address
- IMEI
- Today’s distance
- Today’s engine hours
- Ignition state
- Odometer
- Total engine hours
- Satellite count
The address is resolved from the vehicle’s coordinates. It may temporarily show Loading address while the location is being resolved.
If a readable address cannot be obtained, the remaining telemetry can still be used.
The state duration updates while the tooltip remains open. Open VTS uses a stability window around movement transitions so that the status does not rapidly switch between Running and Stopped because of brief or irregular packets.
Select a Vehicle
Select a vehicle from the list or click its marker on the Map.
Open VTS then:
- Highlights the vehicle row
- Highlights the marker
- Focuses the Map on the vehicle
- Opens the live vehicle summary
- Opens the bottom Vehicle Details panel
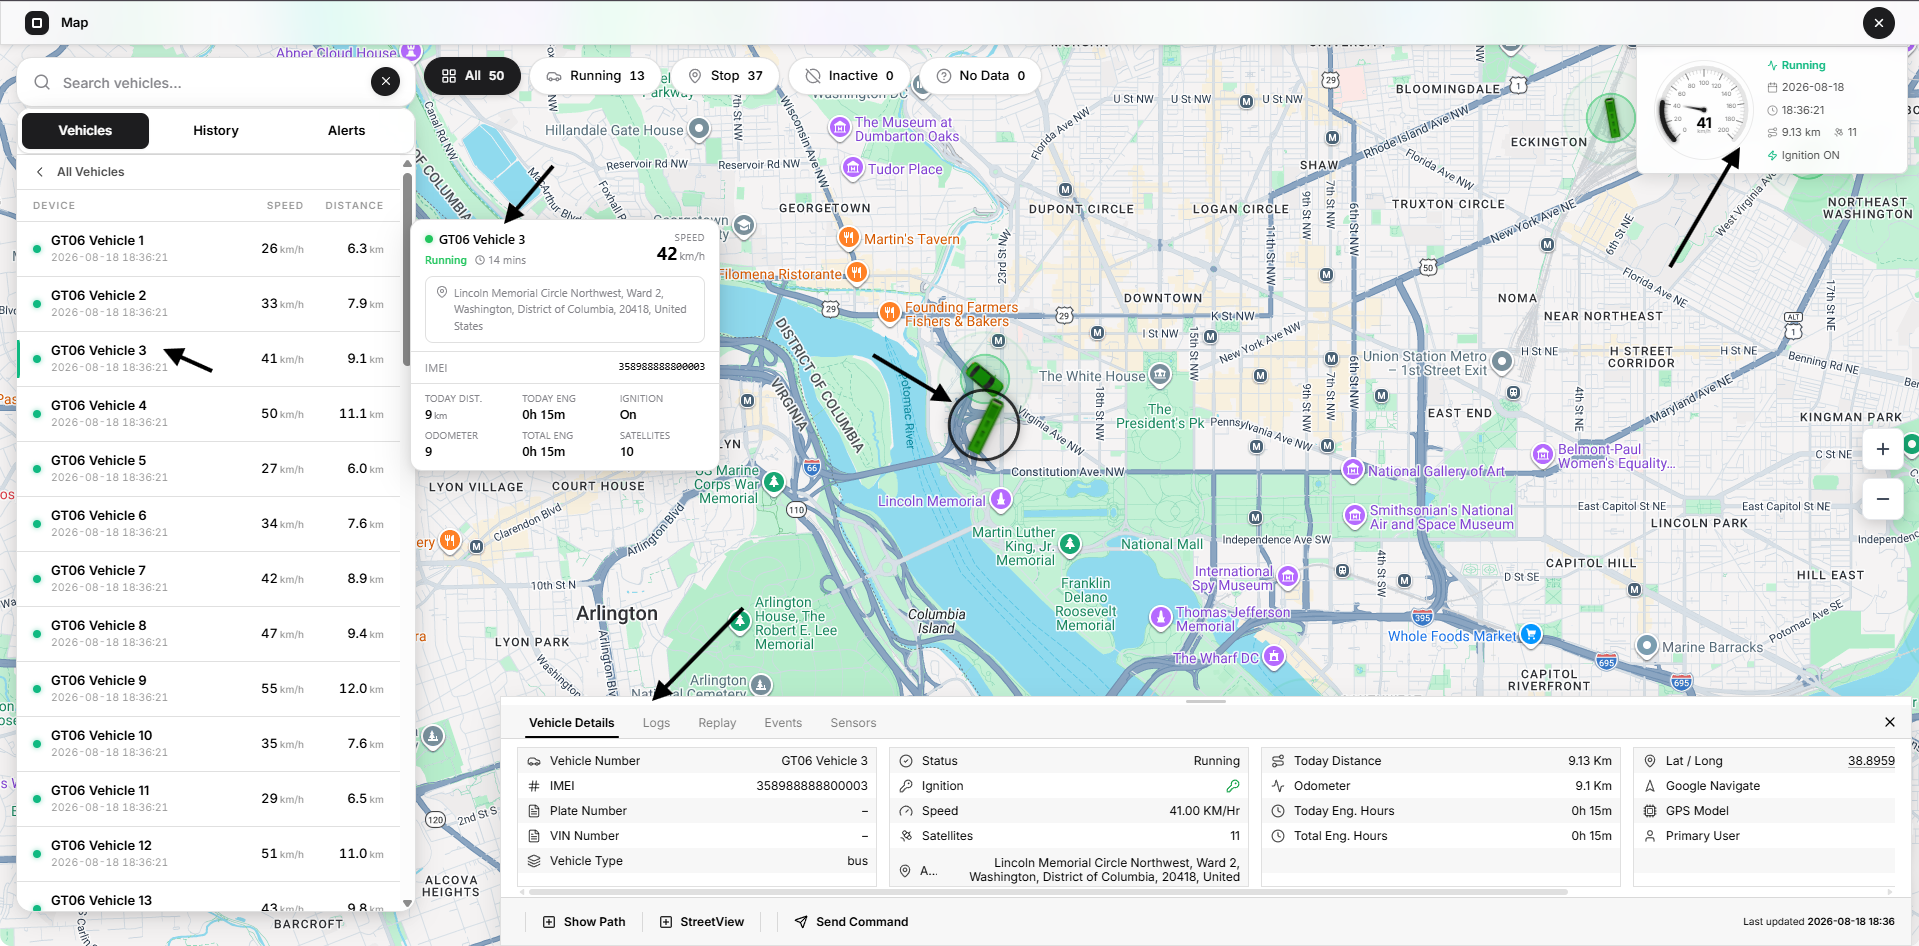
The selected marker remains outside a cluster so it can be seen and followed individually.
Live Vehicle Summary
The live summary appears in the upper-right corner after a vehicle is selected.
It can show:
- Live indicator
- Vehicle name
- IMEI
- Map socket connection indicator
- Speedometer
- Current state
- Telemetry date
- Telemetry time
- Today’s distance
- Satellite count
- Ignition state
- Address, when available
The connection icon represents the Map’s live telemetry connection. It should not be interpreted as the only source of truth for the individual device’s operational state.
Select the X in the live summary to clear the vehicle selection and close the vehicle workspace.
Vehicle Details Panel
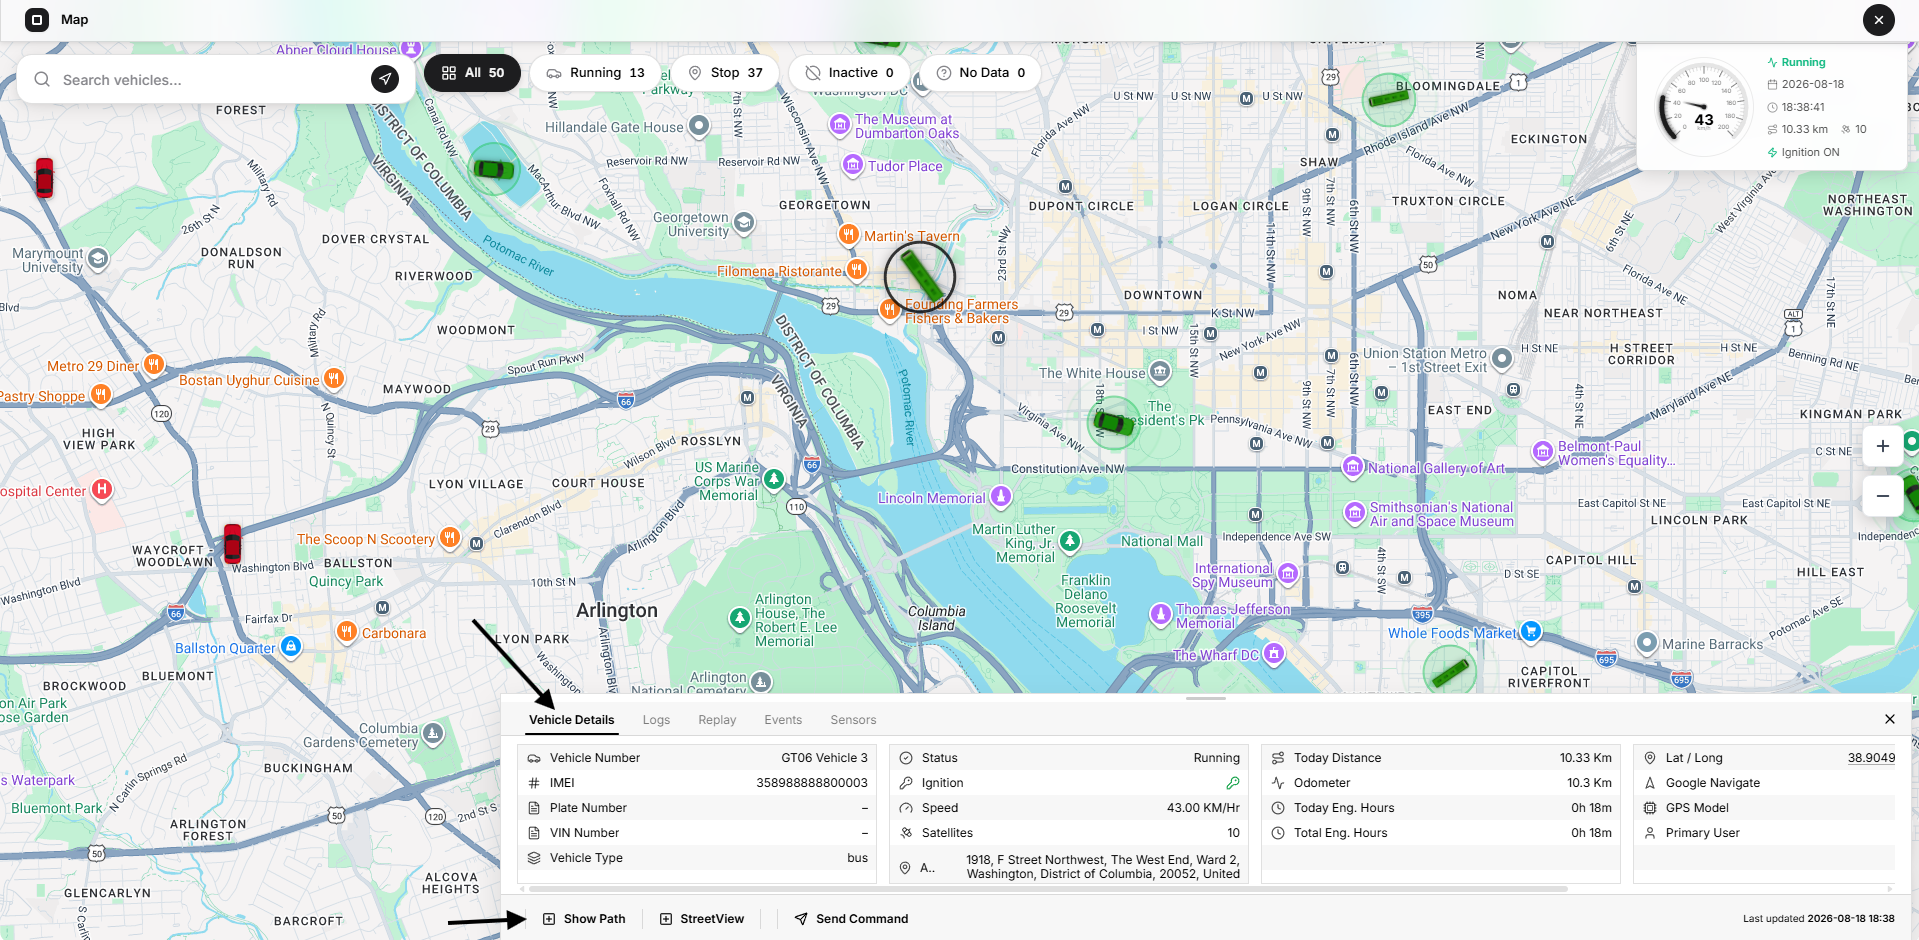
The Vehicle Details panel opens along the bottom of the Map.
It contains these tabs:
- Vehicle Details
- Logs
- Replay
- Events
- Sensors
The panel also contains:
- Show Path
- StreetView
- Send Command
- Last-updated time
- Close control
Drag the handle along the top edge of the panel upward or downward to resize it.
The panel supports a compact height for general monitoring and a larger height for reviewing logs, events, sensors, or detailed telemetry.
When the vehicle is restricted by licensing, the panel displays a warning and disables protected actions such as:
- Show Path
- StreetView
- Send Command
Vehicle Details Tab
The Vehicle Details tab provides a structured view of the selected vehicle’s identity, telemetry, location, usage, and metadata.
Because the information is wider than the panel, use the horizontal scrollbar to view all columns.
Vehicle Identity
Vehicle Number
Shows the vehicle number or display name.
IMEI
Shows the unique identifier of the assigned GPS device.
Plate Number
Shows the vehicle registration or plate number.
A dash appears when no value is stored.
VIN Number
Shows the Vehicle Identification Number.
A dash appears when it is unavailable.
Vehicle Type
Shows the configured vehicle type.
Live Status
Status
Shows the current effective vehicle state, such as:
- Running
- Stopped
- Inactive
Ignition
Shows the latest ignition or ACC state.
Speed
Shows the latest effective vehicle speed.
Satellites
Shows the number of GPS satellites reported in the latest telemetry.
Address
Shows the stored or resolved address for the vehicle’s latest coordinates.
Distance and Engine Information
Today Distance
Shows the calculated distance for the current day.
Odometer
Shows the latest available odometer value.
Today Engine Hours
Shows engine hours accumulated for the current day.
Total Engine Hours
Shows the latest total engine-hours value.
Location and Assignment
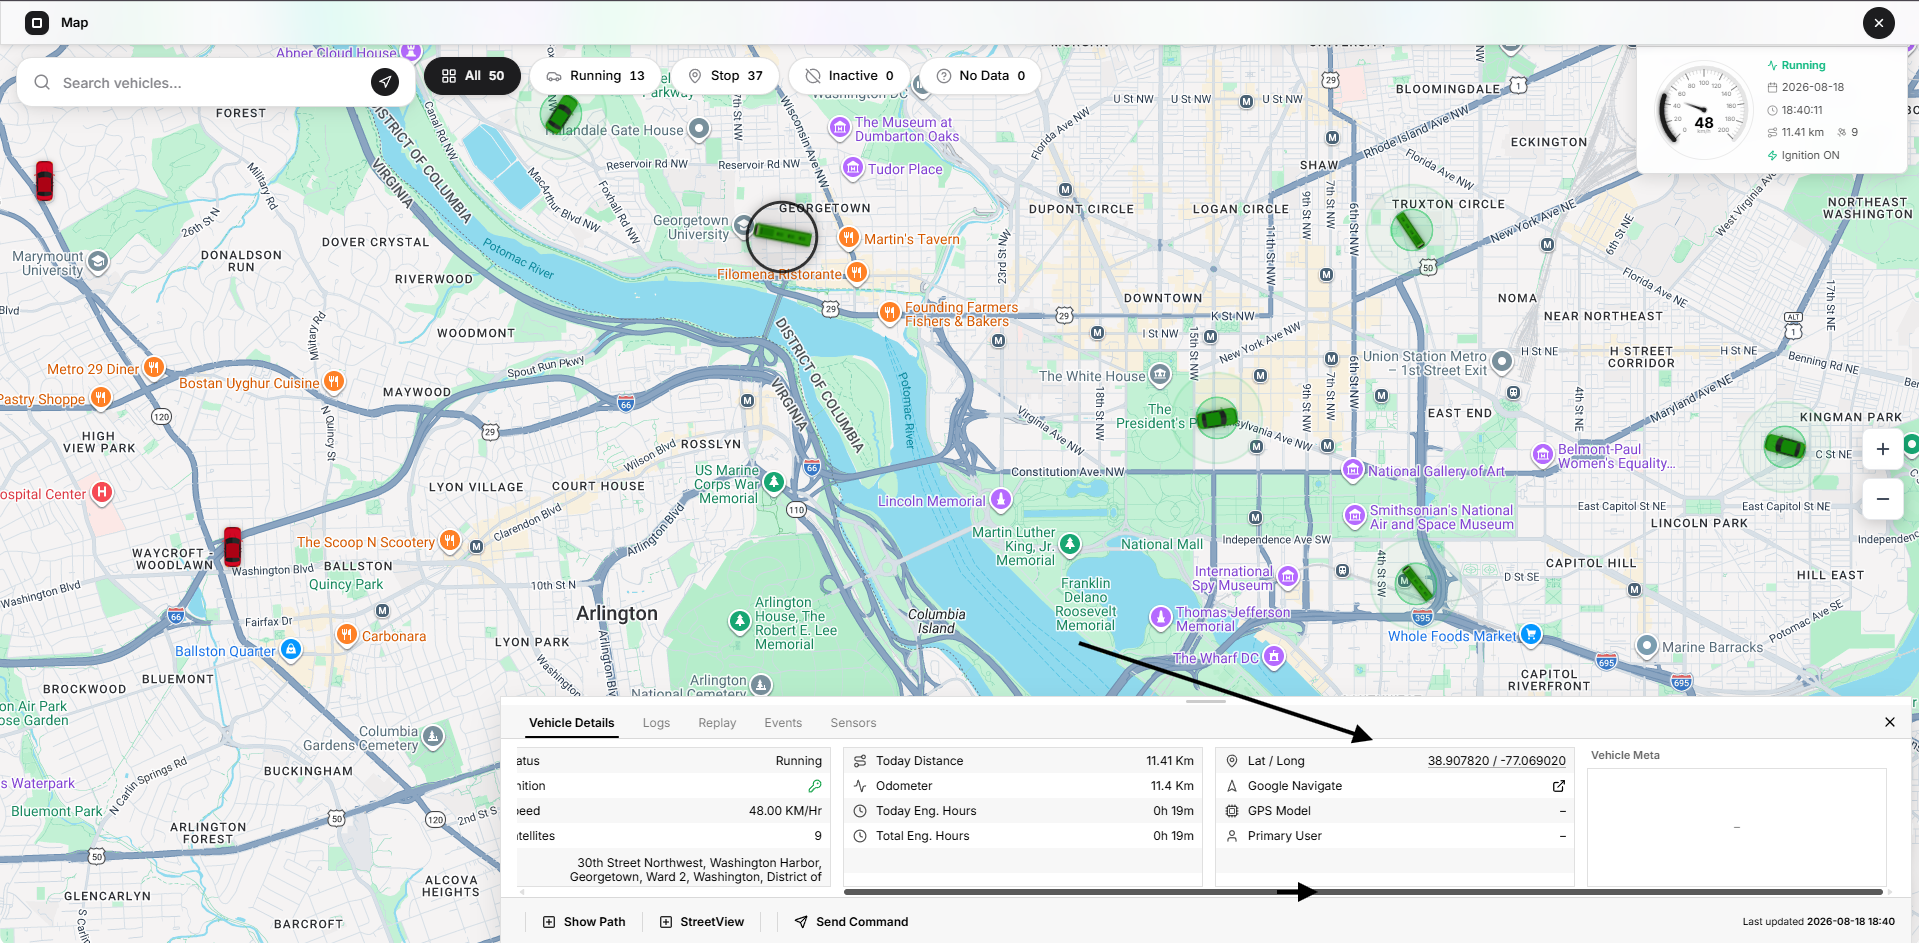
Lat / Long
Shows the latest latitude and longitude.
Select the coordinates to open the position in Google Maps.
Google Navigate
Opens Google Maps directions with the vehicle’s coordinates as the destination.
GPS Model
Shows the configured GPS device model.
Primary User
Shows the User assigned as the primary User of the vehicle.
Vehicle Meta
Vehicle Meta shows additional stored vehicle information that is not included in the standard columns.
The current panel displays up to twelve metadata entries in alphabetical order.
Simple values are displayed directly. Complex nested values may be represented by an abbreviated value.
Show Path
Select Show Path to display the selected vehicle’s recorded path from the start of the current day until the current time.
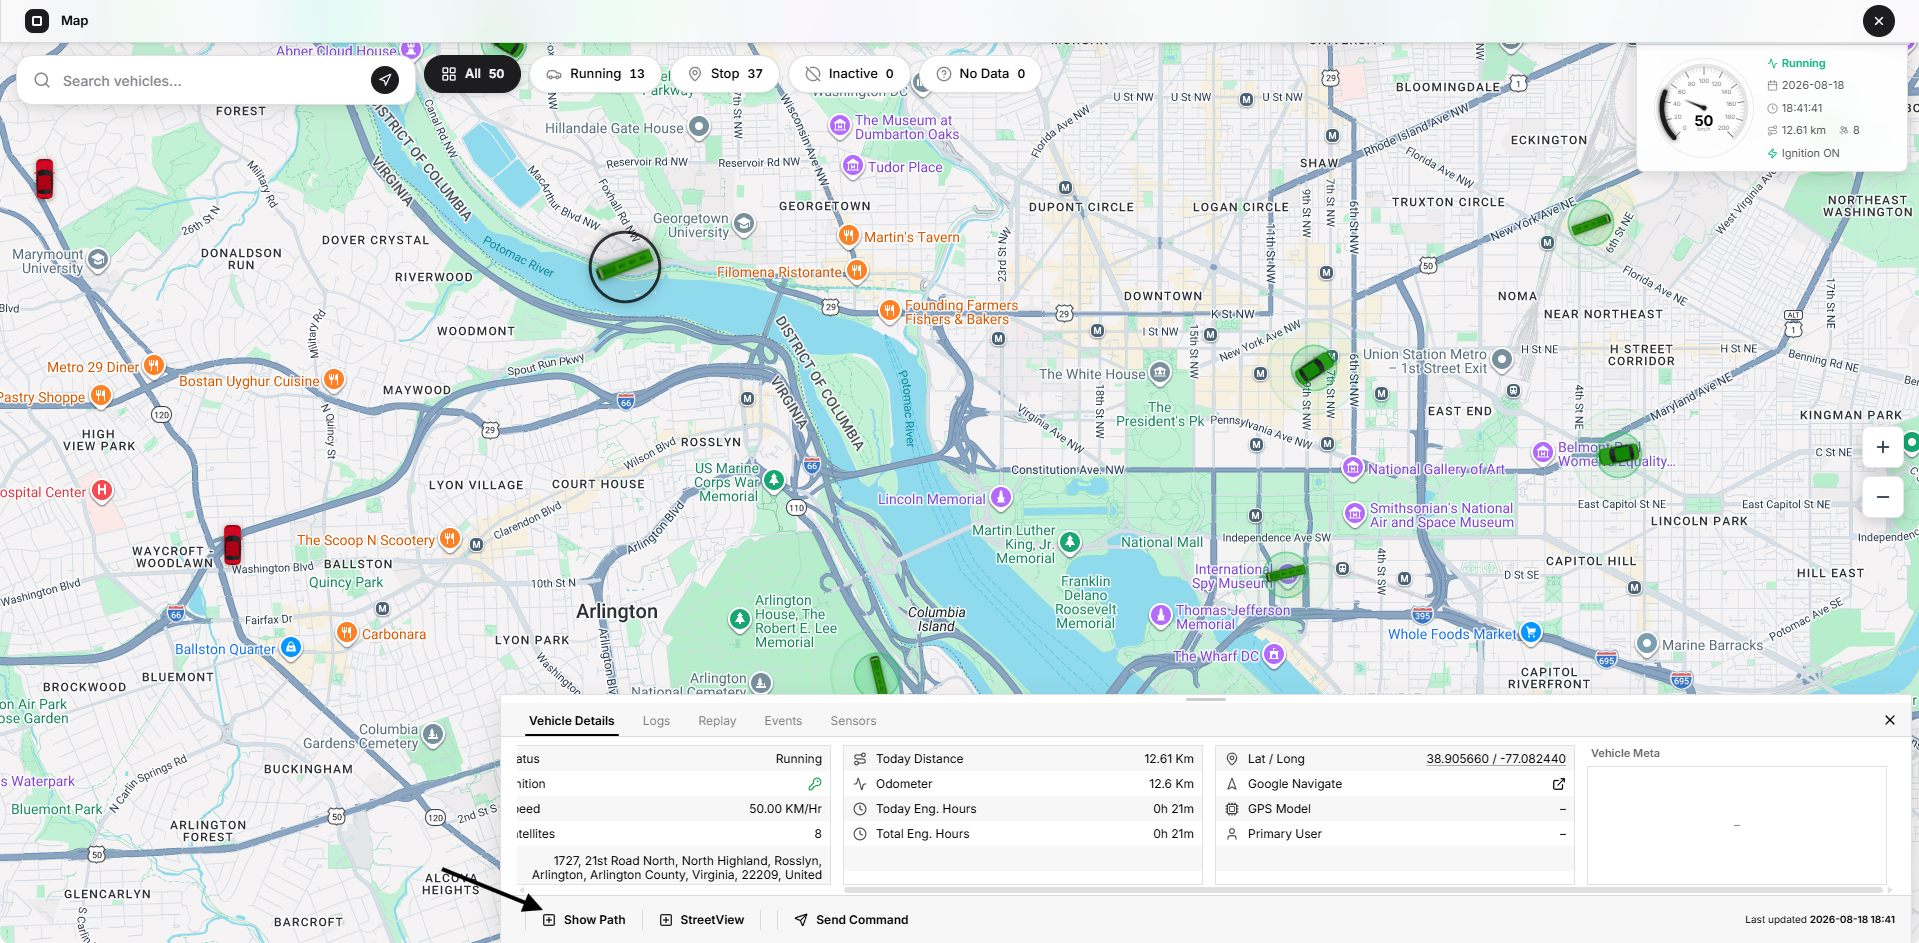
Show Path:
- Loads the current day’s telemetry
- Uses up to 500 path points
- Draws the complete route
- Shows direction arrows
- Displays route-point information
- Fits the Map around the loaded path
- Keeps the selected vehicle visible
Select Show Path again to remove the displayed path.
If no usable points exist for the current day, no route is drawn.
Starting Show Path clears active History and Replay views so that multiple route modes do not overlap.
Changing the selected vehicle also removes the previous vehicle’s Show Path.
StreetView
Select StreetView to open Google Street View using the selected vehicle’s latest valid coordinates.
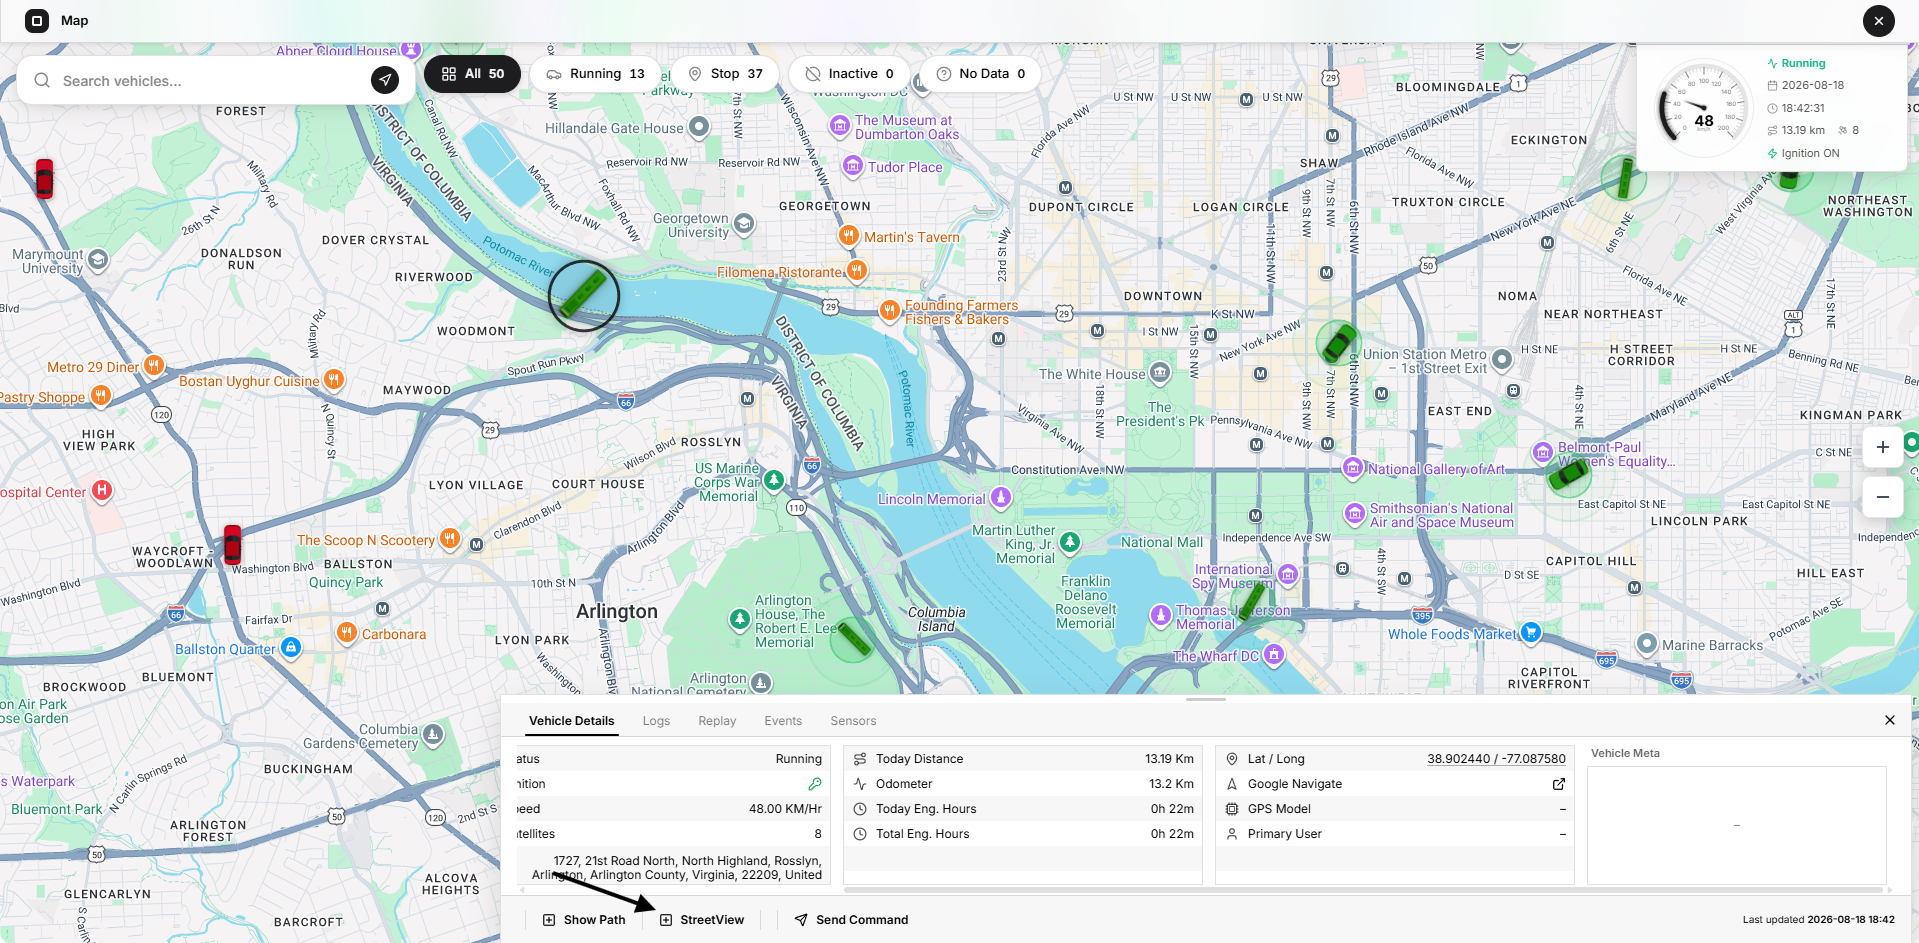
StreetView opens in a separate browser tab.
The result depends on Google Street View coverage at or near the selected coordinates. In some areas, Google may open the nearest available panorama.
StreetView requires valid latitude and longitude values and is disabled for a license-restricted vehicle.
Send Command
Select Send Command to send a supported command to the GPS device assigned to the selected vehicle.
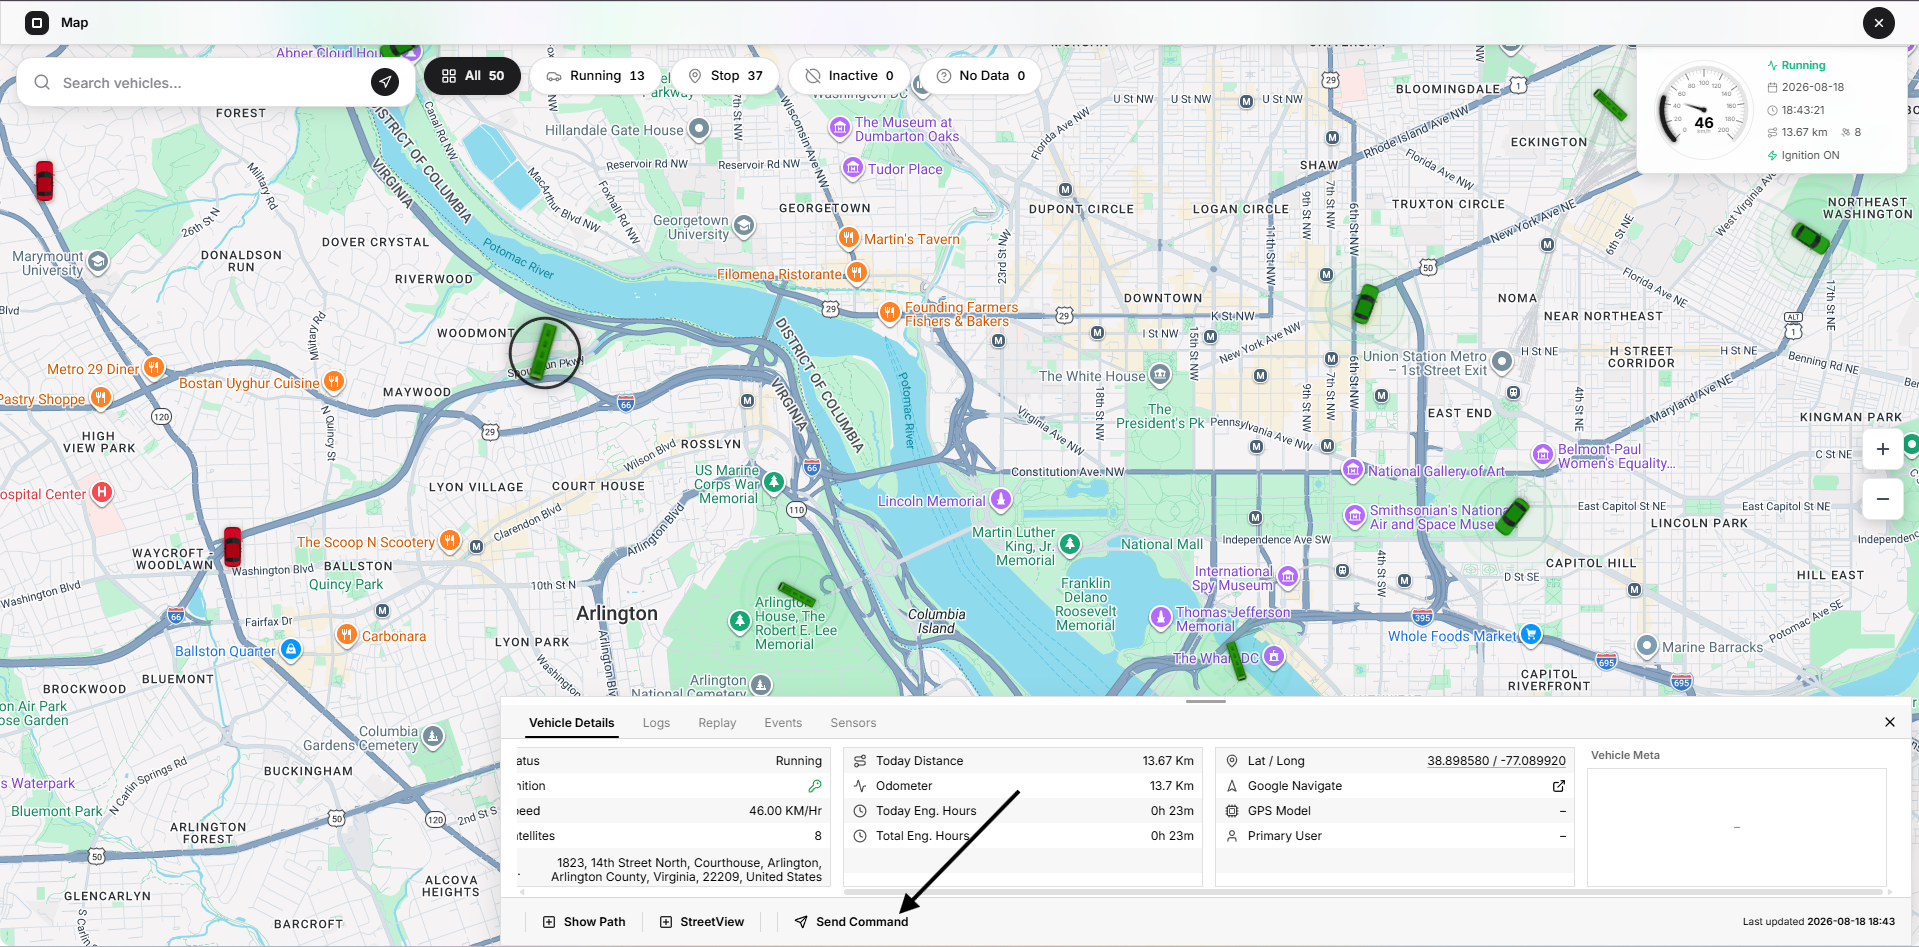
The command window displays the selected vehicle context:
- Vehicle name or number
- IMEI
- Device protocol
- Communication method
The current communication method is displayed as GPRS.
Command Type
Use Type to filter the active command templates available for the selected device type.
The default option is All Types.
When the available command list changes, Open VTS selects the first applicable active command and loads its payload template.
Only commands configured in Master Data and applicable to the selected device type are available.
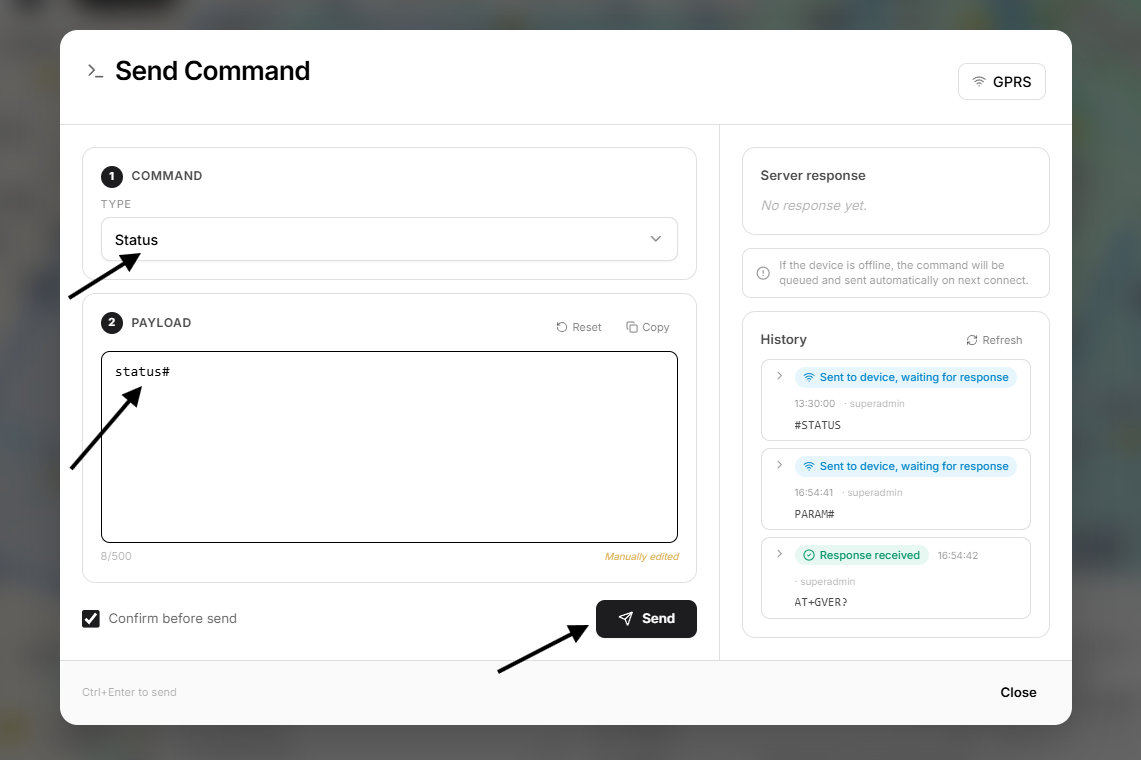
Payload
The Payload field shows the command that will be sent.
Templates can contain variables. Available values can be resolved from:
- System variables
- IMEI
- Latitude
- Longitude
- Speed
- Telemetry timestamp
- Values entered for the command
The payload can be edited manually.
A manually edited payload can be reset to the original template.
The current maximum payload length is 500 characters.
Use Copy to copy the payload.
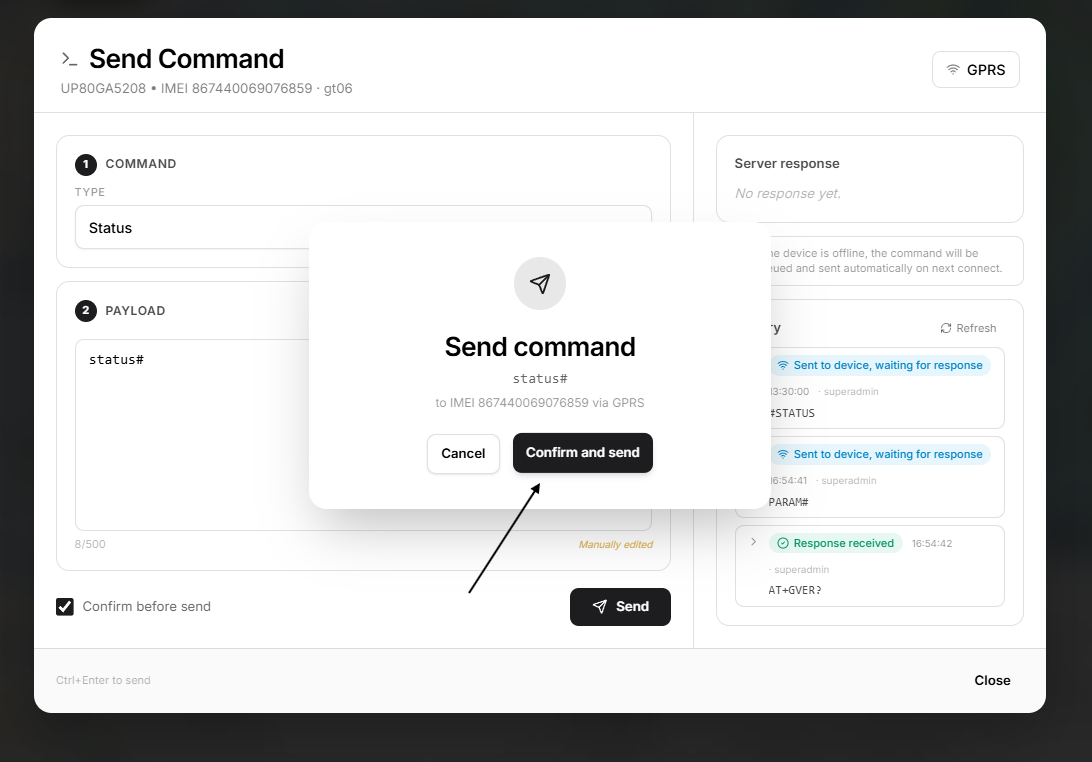
Confirm Before Send
Confirm before send is enabled by default.
When enabled, Open VTS asks for confirmation before sending the payload.
The confirmation shows:
- Command payload
- IMEI
- GPRS delivery method
Disable this option only when the command and its effect are fully understood.
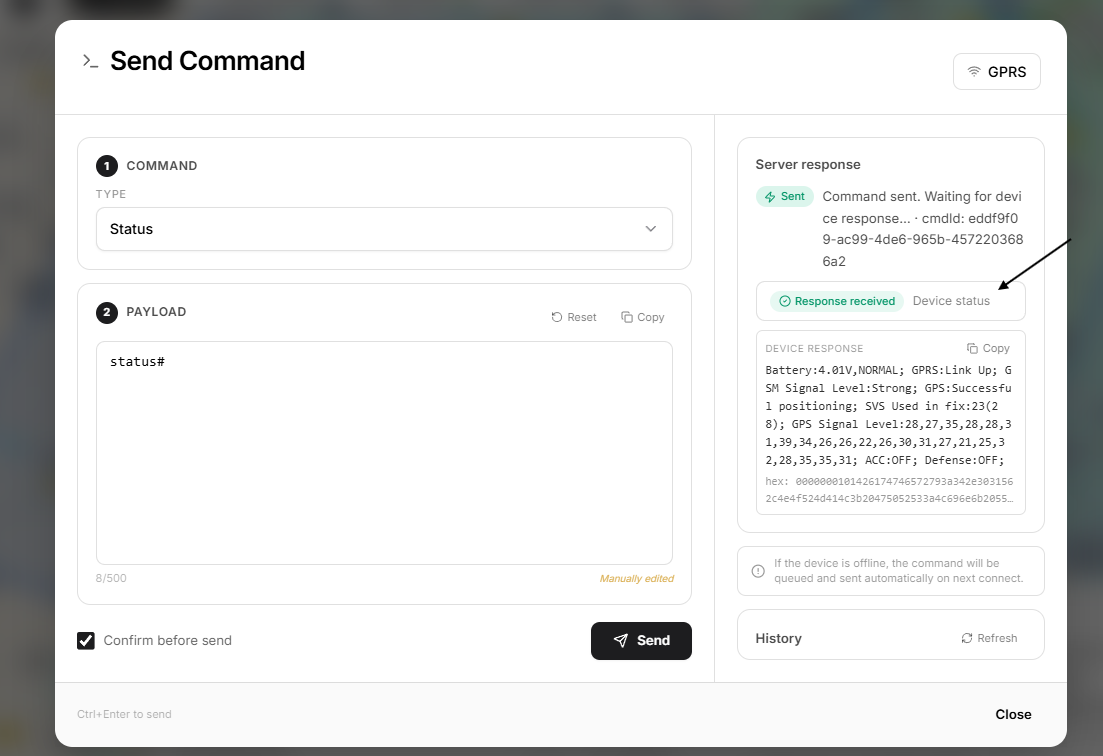
Send the Command
Select Send, or use Ctrl + Enter.
The Server Response area can show:
- Sent
- Queued
- Error
- Device-command status
- Waiting for device response
- Raw device response
- Hexadecimal response
- Pipeline or device error
If the device is connected, the command can be sent immediately.
If the device is offline, the command is queued and sent automatically after the device reconnects.
A successful server send does not always mean the GPS device has completed the requested action. Review the device response and command history.
Command History
The History area shows durable command records for the selected device.
A history entry can include:
- Payload
- Time
- User who sent it
- Queue or send state
- Device response state
- Error or timeout state
Use Refresh to retrieve the latest command status.
Use commands carefully. Commands such as relay control, restart, configuration changes, or immobilization can affect active vehicles and physical equipment.
Logs Tab
The Logs tab provides a detailed telemetry stream for the selected vehicle.
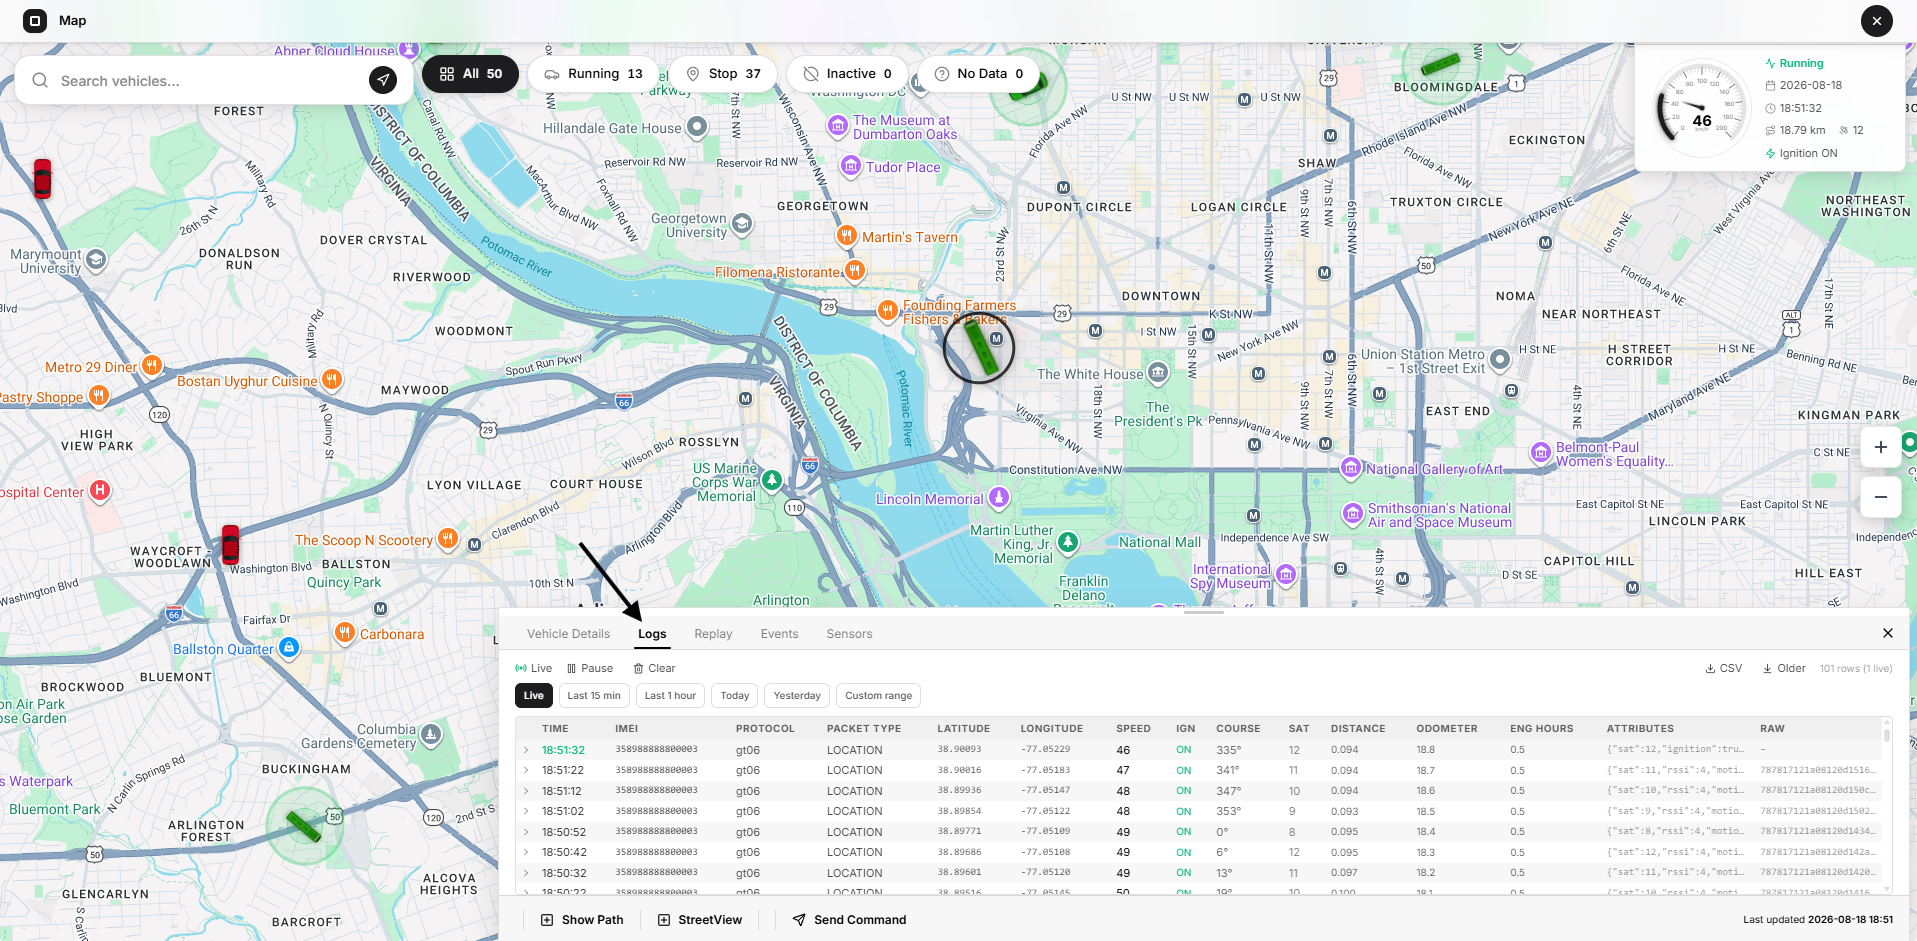
It supports both:
- Live incoming telemetry
- Stored historical telemetry
Live Connection State
The upper-left status can display:
- Live
- Connecting
- Paused
Live means the per-vehicle telemetry-log stream is connected.
Pause
Select Pause to stop adding new live entries to the visible list.
Pausing does not delete the rows already displayed.
Select Resume to continue receiving live entries.
Clear
Select Clear to remove the current live entries from the local view.
Clear does not delete stored telemetry from the database.
Logs Time Ranges
The available range options are:
- Live
- Last 15 min
- Last 1 hour
- Today
- Yesterday
- Custom range
Live
Combines recent stored rows with incoming live socket entries.
Live entries are visually distinguished in the Time column.
Last 15 min
Loads stored telemetry from the latest fifteen-minute period.
Last 1 hour
Loads stored telemetry from the latest hour.
Today
Loads stored telemetry from the beginning of the current day.
Yesterday
Loads the previous day’s telemetry.
When a historical preset is active, Open VTS indicates that history is loaded and instructs the user to switch to Live for the current stream.
Custom Range
Allows an exact start and end date and time to be selected.
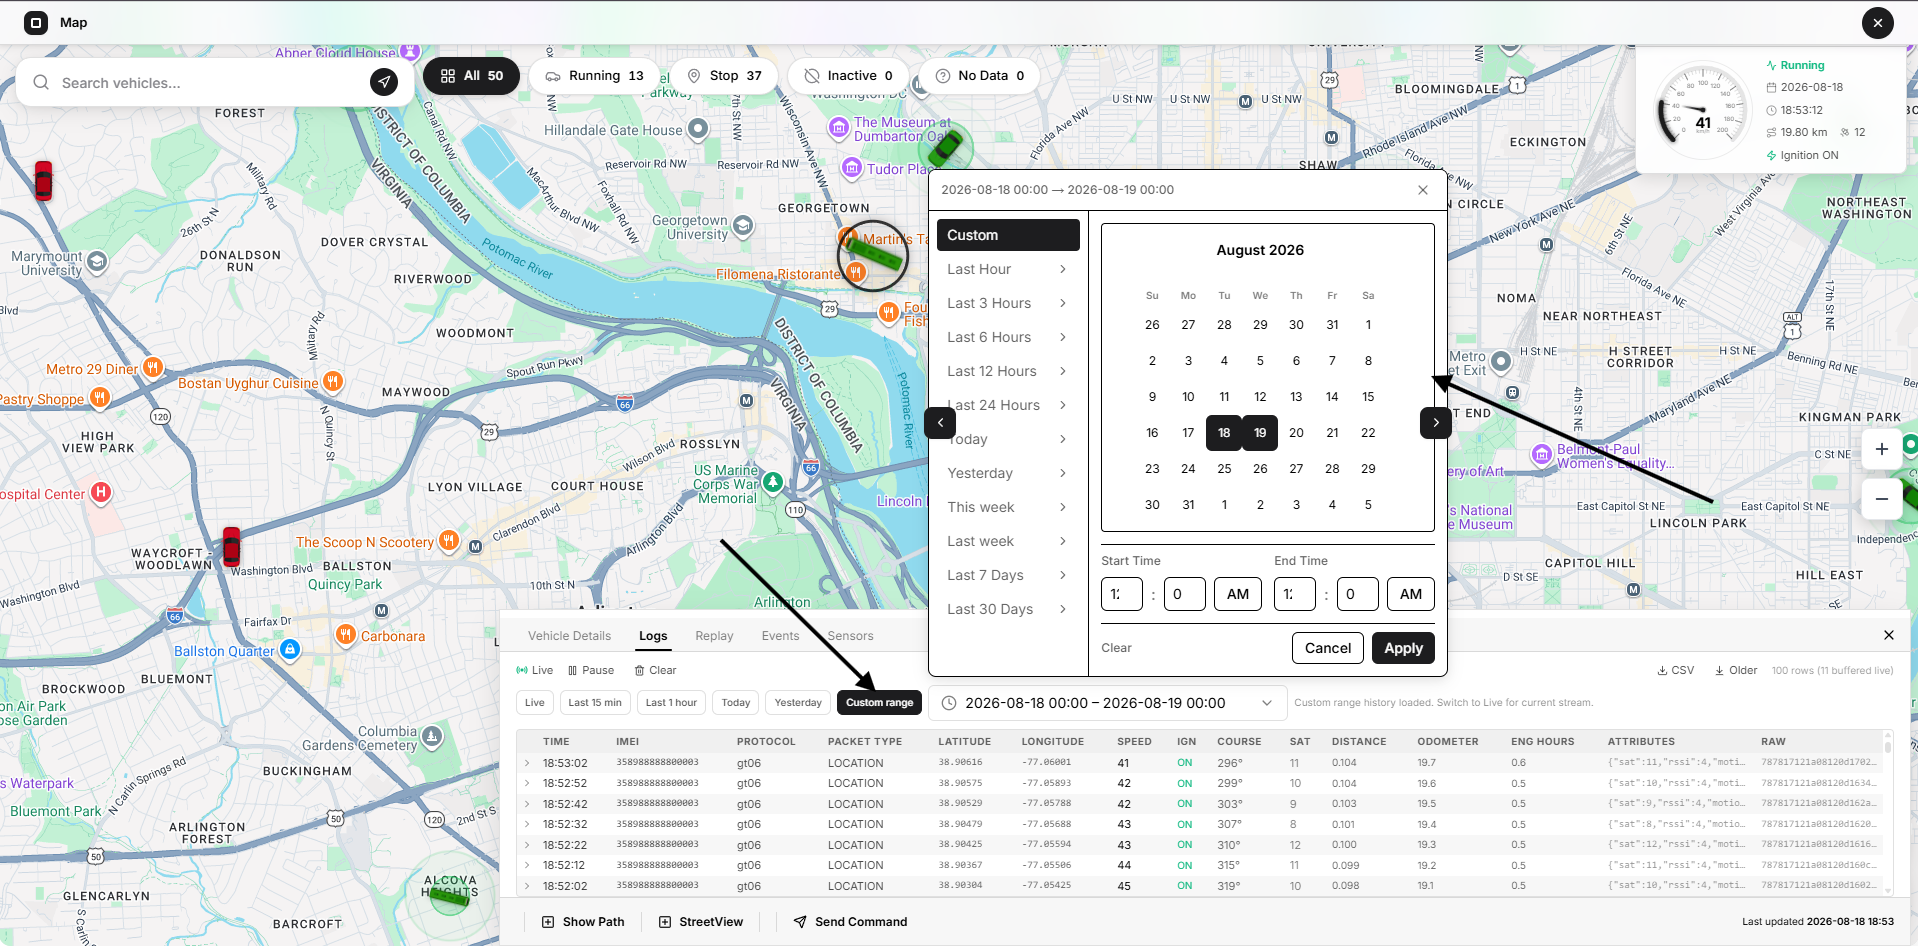
Available presets inside the range selector include:
- Last Hour
- Last 3 Hours
- Last 6 Hours
- Last 12 Hours
- Last 24 Hours
- Today
- Yesterday
- This week
- Last week
- Last 7 Days
- Last 30 Days
- Custom
Select Apply to load the range.
If the custom start or end is missing, Open VTS asks the user to choose both values before loading the logs.
Live entries that arrive while a historical range is being reviewed can remain buffered. The row indicator identifies buffered live entries separately.
Logs Table
The table contains these columns:
- Time
- IMEI
- Protocol
- Packet Type
- Latitude
- Longitude
- Speed
- IGN
- Course
- SAT
- Distance
- Odometer
- Eng Hours
- Attributes
- Raw
Time
Shows the effective telemetry timeline time.
Protocol
Shows the device protocol, such as GT06.
Packet Type
Shows the normalized packet category, such as LOCATION.
IGN
Shows ignition as ON, OFF, or unavailable.
Course
Shows the direction in degrees.
SAT
Shows the reported satellite count.
Attributes
Shows telemetry attributes in a shortened JSON representation.
Raw
Shows the original raw packet when it is available from stored data.
Live socket rows may not contain raw packet data.
Expanded Log Details
Select a log row to expand it.
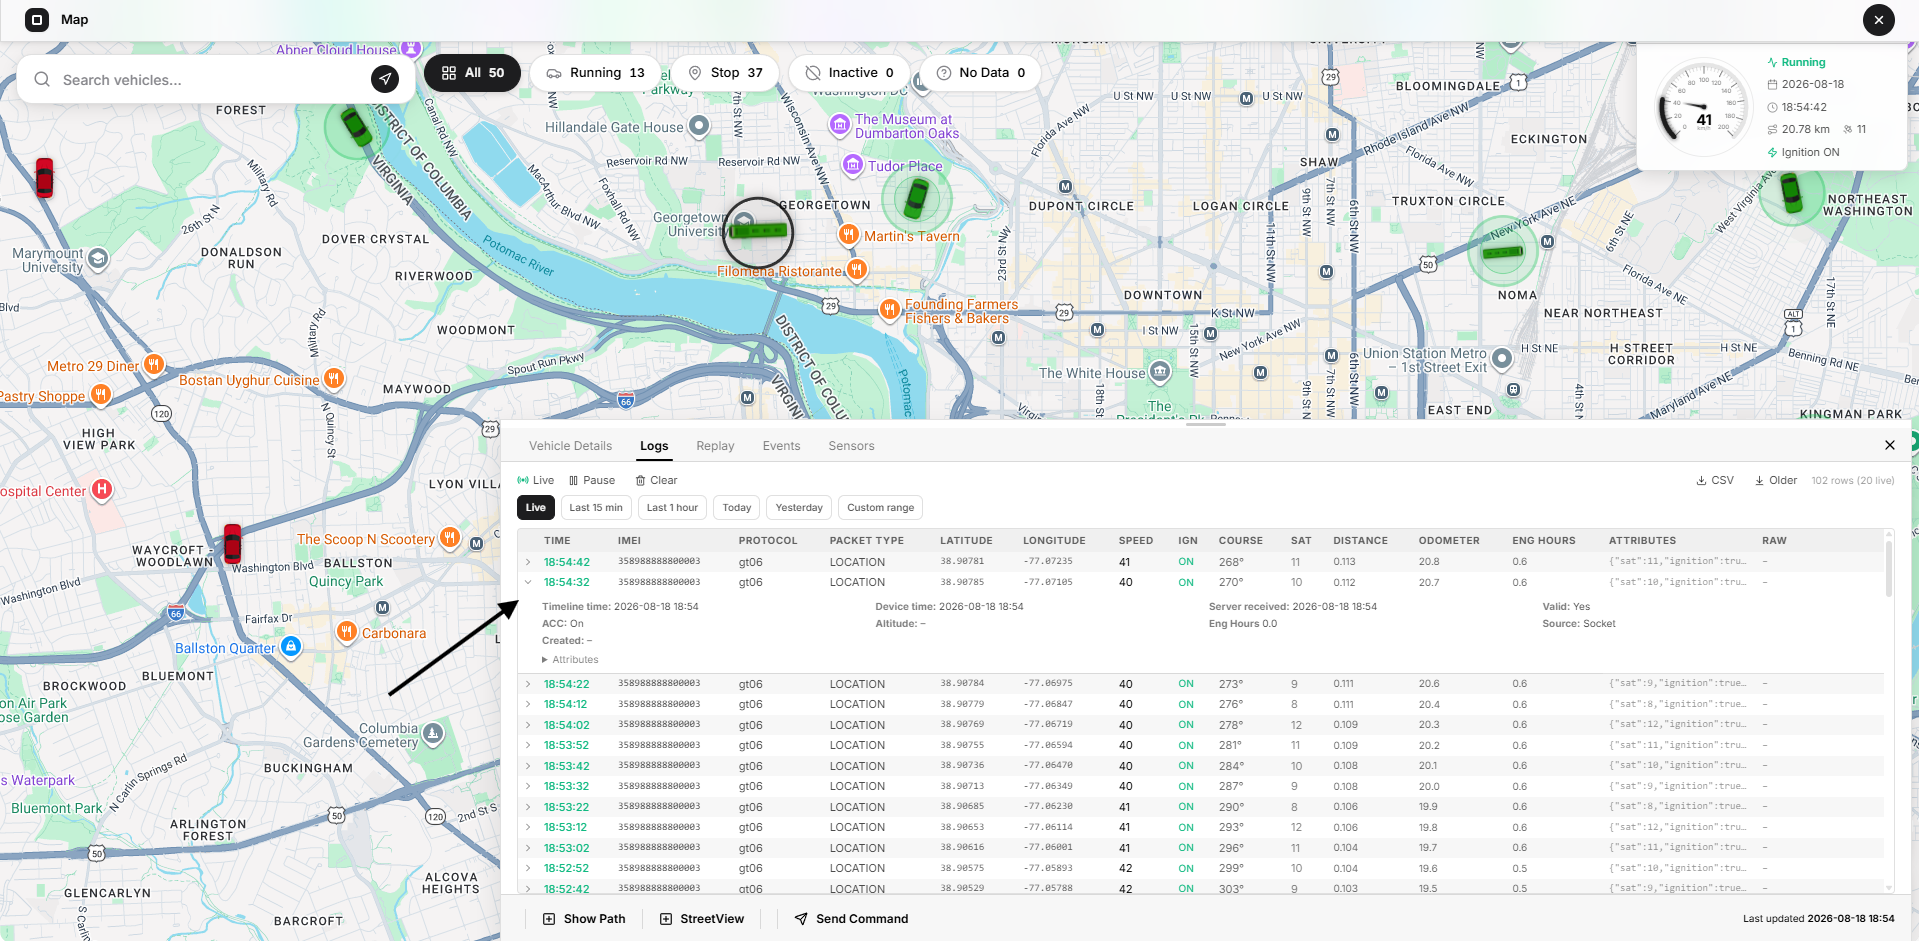
The expanded view can show:
- Timeline time
- Device time
- Server-received time
- Valid status
- ACC
- Altitude
- Engine hours
- Source
- Created time
- Raw hexadecimal data
- Full attributes JSON
The Source identifies whether the row came from:
- Socket: Incoming live telemetry
- Database: Stored telemetry
Use the expanded details when investigating:
- Device-time differences
- Delayed packets
- Invalid coordinates
- ACC or ignition discrepancies
- Protocol decoding
- Raw packet problems
- Missing sensor attributes
Load Older Logs
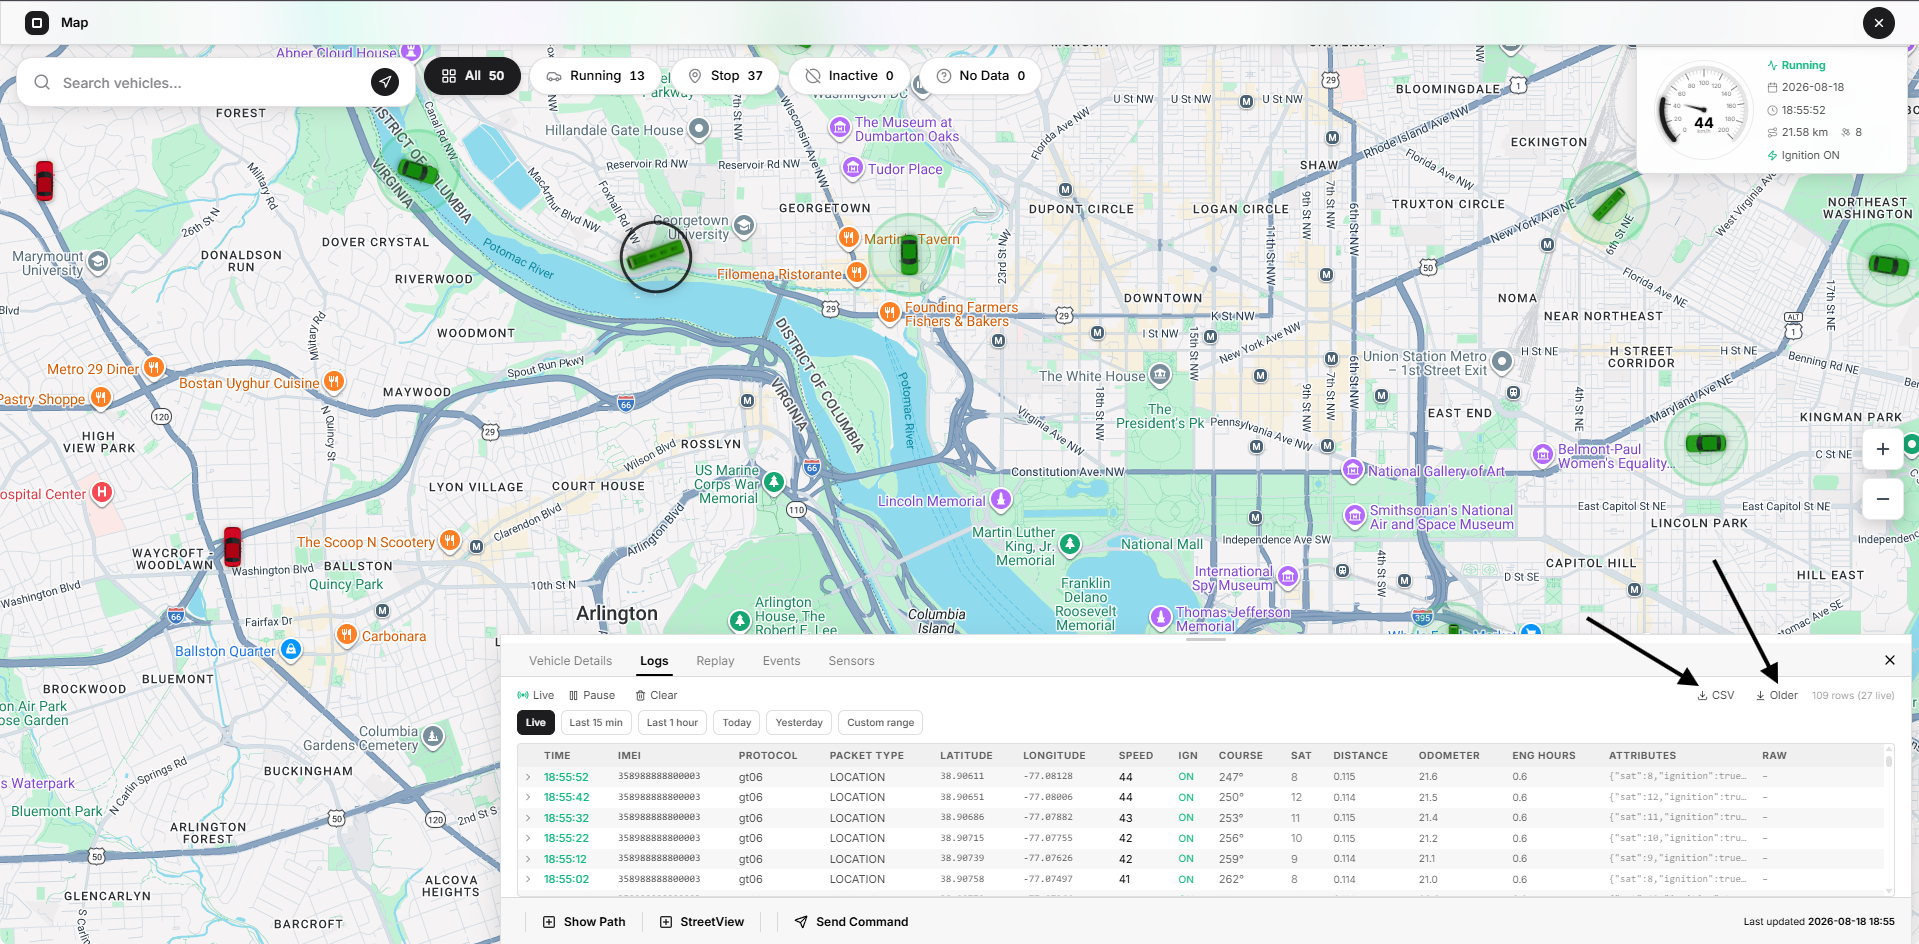
Select Older to load the next available page of older telemetry records.
The button appears only when more records are available.
The displayed list is capped to protect browser performance during long telemetry sessions.
Export Logs
Select CSV to export the currently displayed log rows.
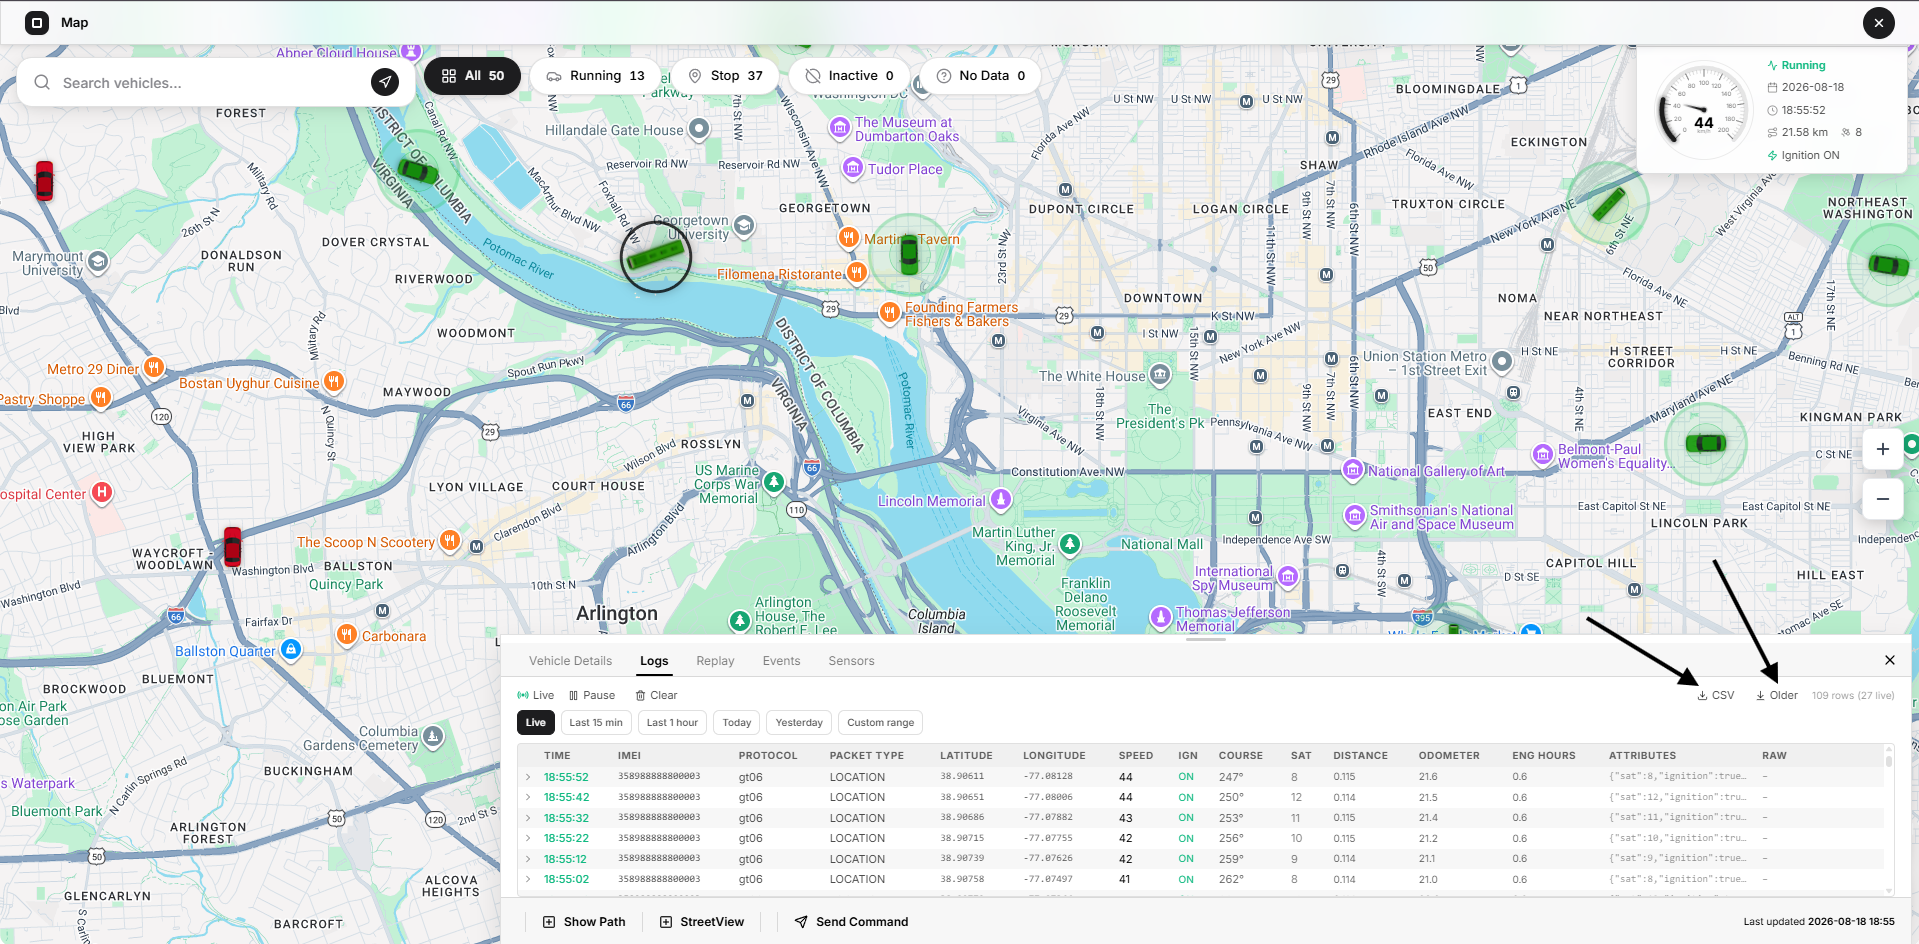
The file can include:
- Timeline time
- Device time
- Server time
- IMEI
- Protocol
- Packet type
- Coordinates
- Speed
- Ignition
- Course
- Satellites
- Distance
- Odometer
- Engine hours
- Attributes
- Raw data
Treat exported telemetry logs as confidential operational data.
Replay Tab
The Replay tab animates a vehicle’s recorded telemetry across a selected period.
Replay differs from Show Path because it allows the user to move through historical points over time.
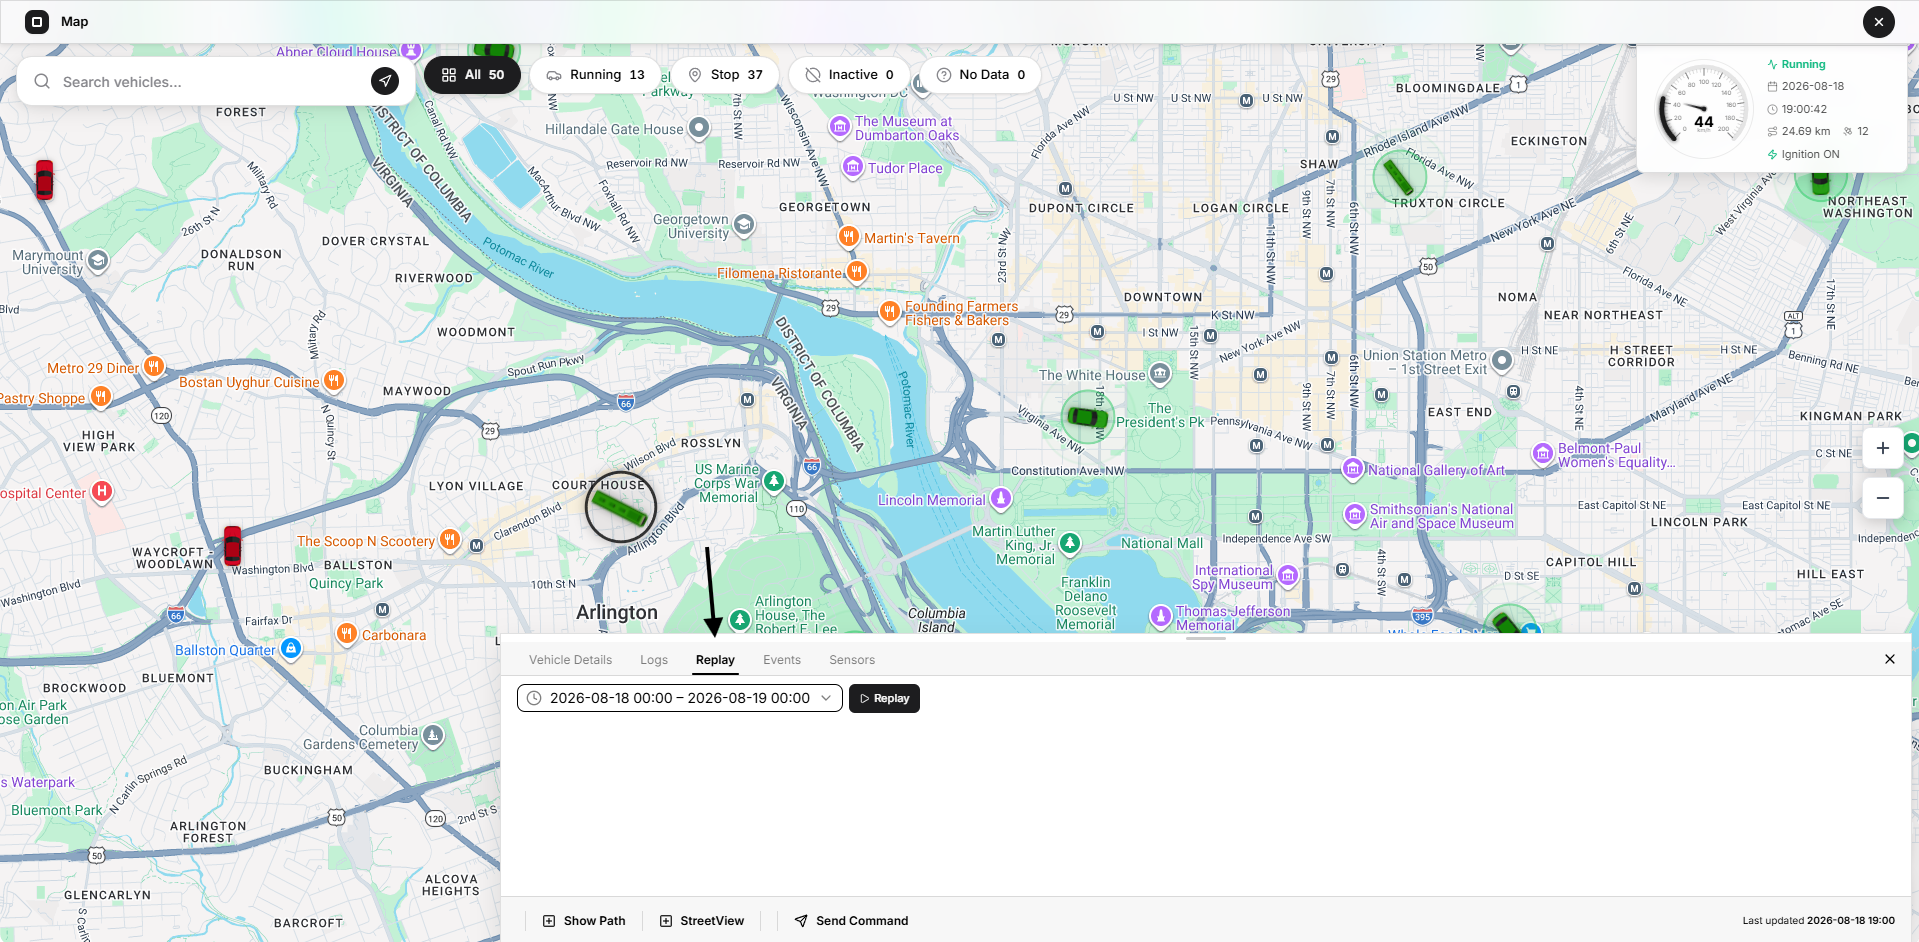
Select a Replay Range
Replay opens with the latest one-hour period selected by default.
Use the date and time selector to choose a different period.
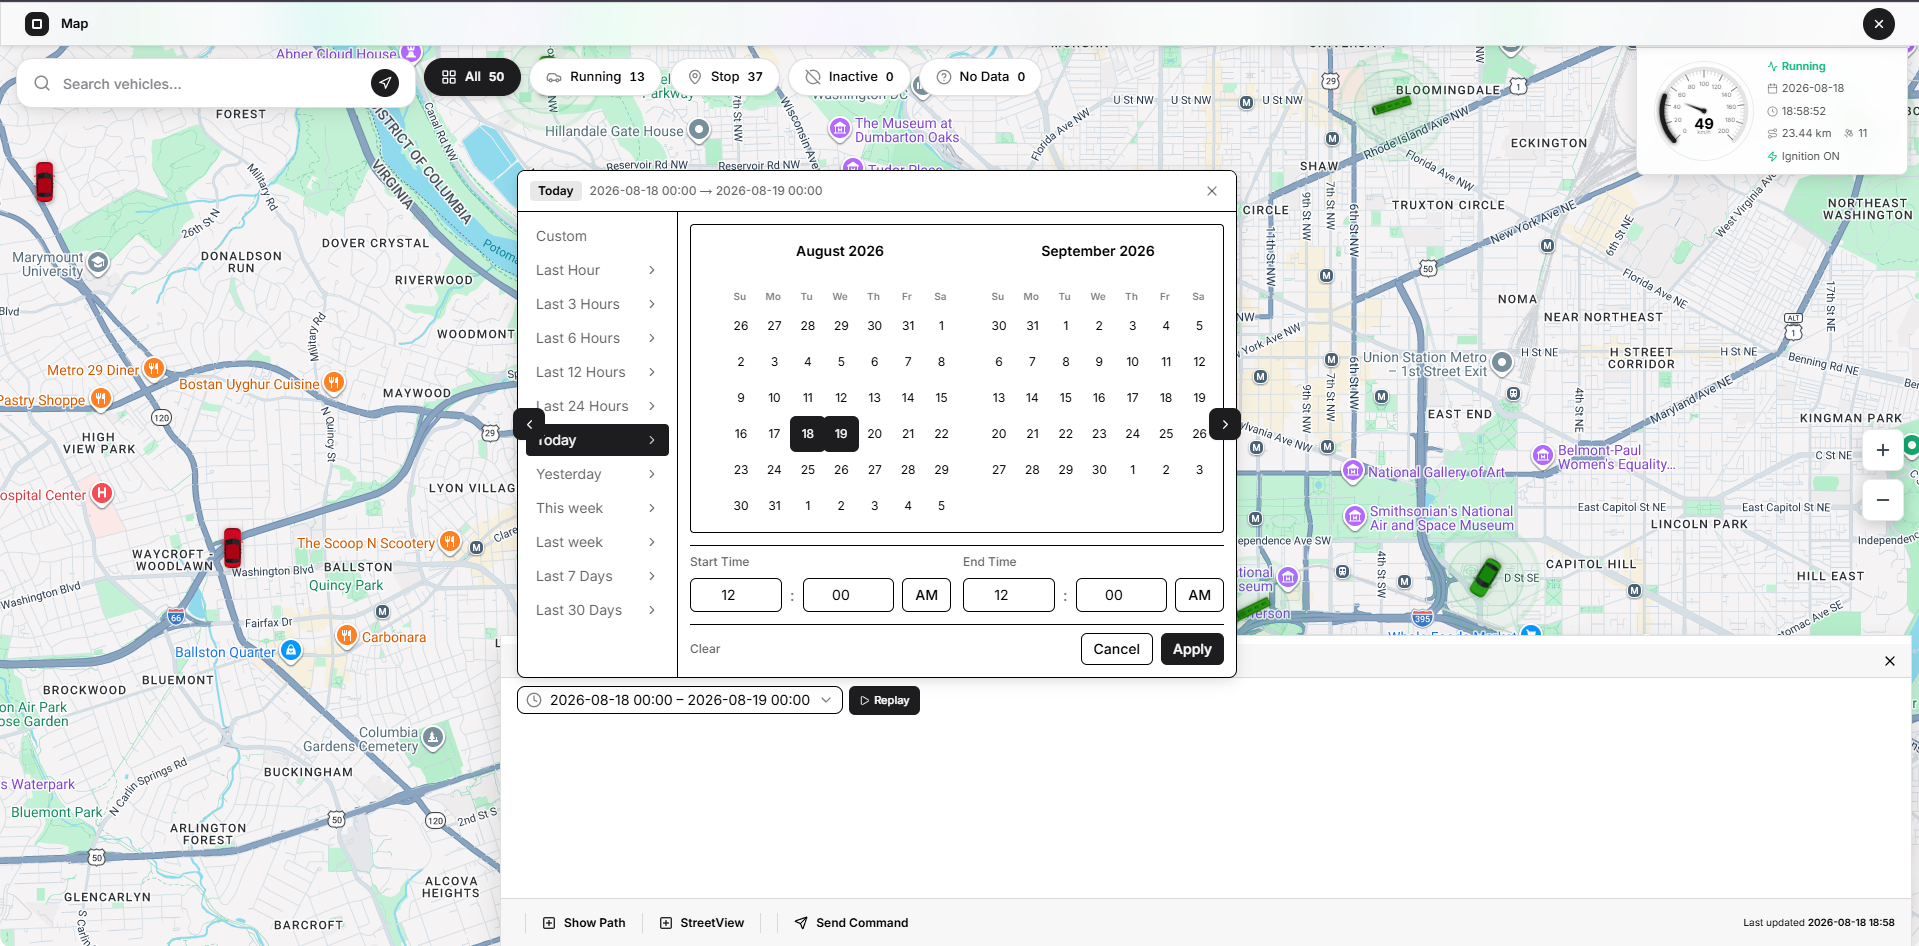
The selector includes:
- Custom
- Last Hour
- Last 3 Hours
- Last 6 Hours
- Last 12 Hours
- Last 24 Hours
- Today
- Yesterday
- This week
- Last week
- Last 7 Days
- Last 30 Days
For a custom period, choose:
- Start date
- Start time
- End date
- End time
Select Apply, then select Replay.
Load Replay
When telemetry is available, Open VTS:
- Draws the full recorded route
- Shows the historical vehicle marker
- Adds direction indicators
- Adds stop-related markers
- Fits the Map around the route
- Opens the replay timeline
- Replaces the live HUD with the Replay HUD
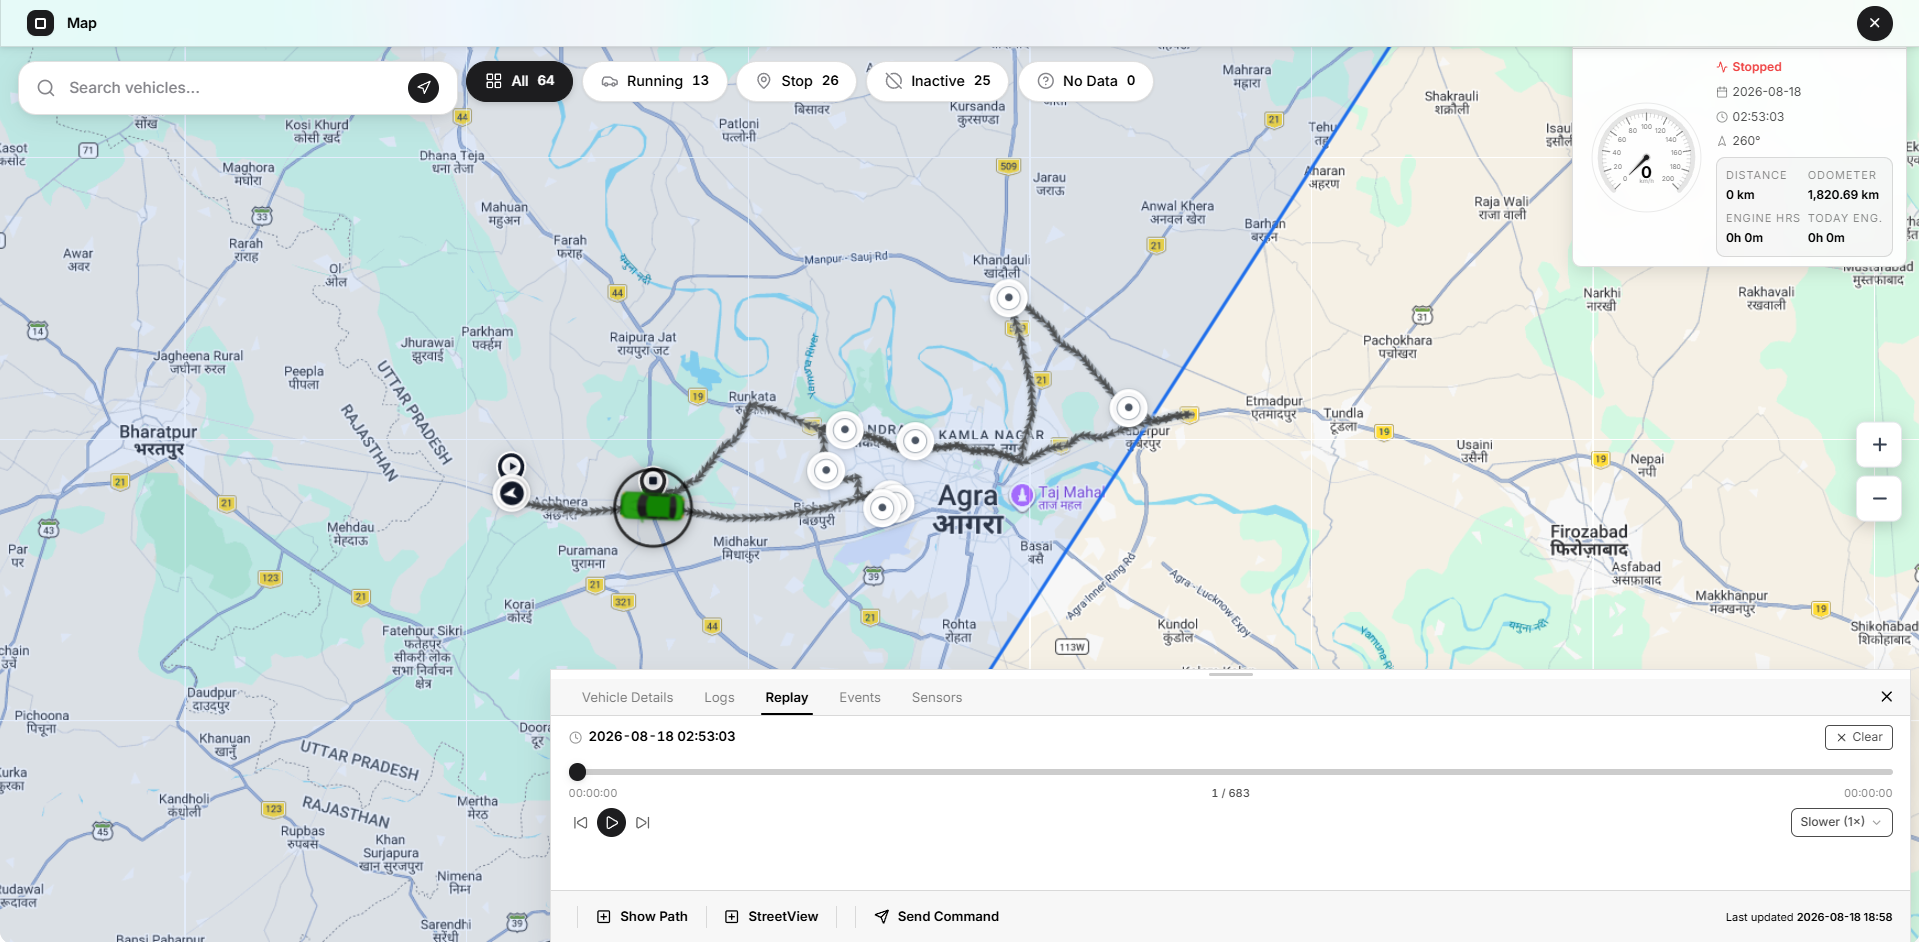
If the selected period contains no usable telemetry points, Open VTS shows a no-data message and does not open the replay.
Starting Replay removes an active Show Path trail. Replay also takes visual priority over History.
Replay Timeline
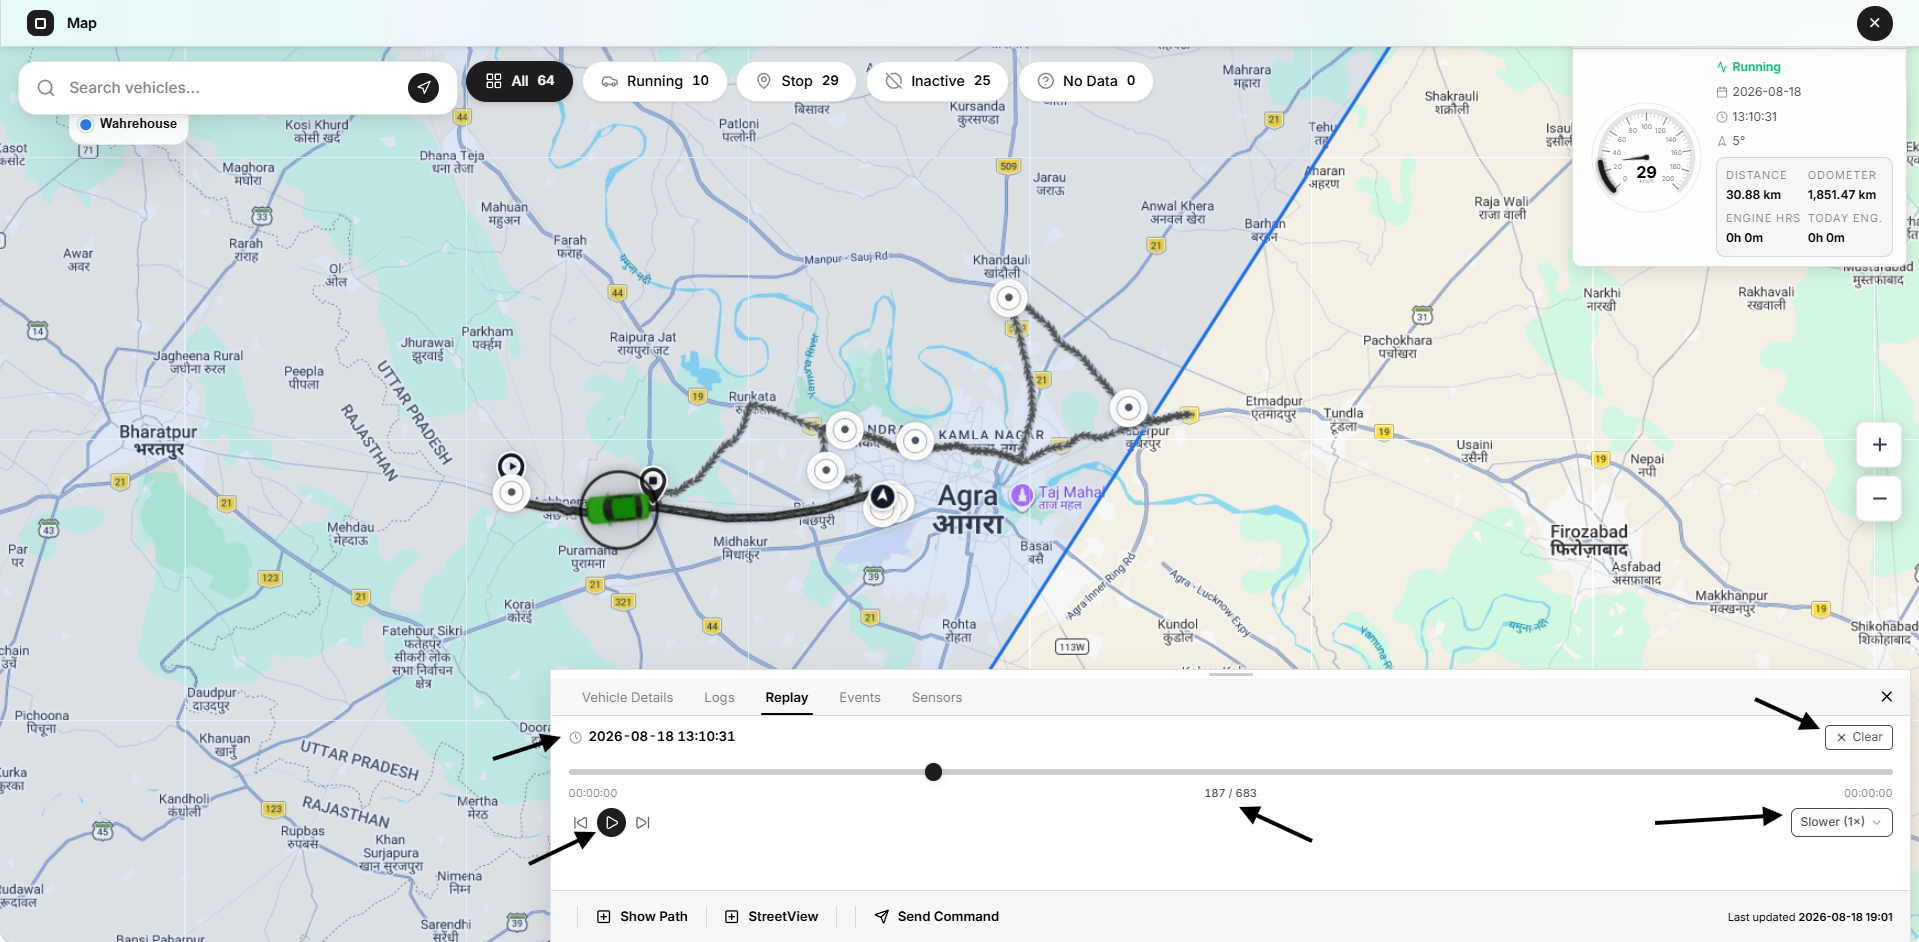
The Replay timeline displays:
- Current historical date and time
- Timeline slider
- Current point
- Total points
- Start button
- Play or Pause
- End button
- Playback-speed selector
- Clear action
A value such as 134 / 719 means the replay is currently showing point 134 of 719 loaded telemetry points.
Drag the slider to jump to another point.
Dragging the slider pauses playback.
Replay Controls
Go to Start
Moves the replay to the first loaded point.
Play or Pause
Starts or pauses animated movement through the telemetry points.
When playback begins, Open VTS follows the replay marker.
Manually moving or zooming the Map disables automatic following so the user can inspect another area.
Go to End
Moves the replay to the final loaded point.
Playback Speed
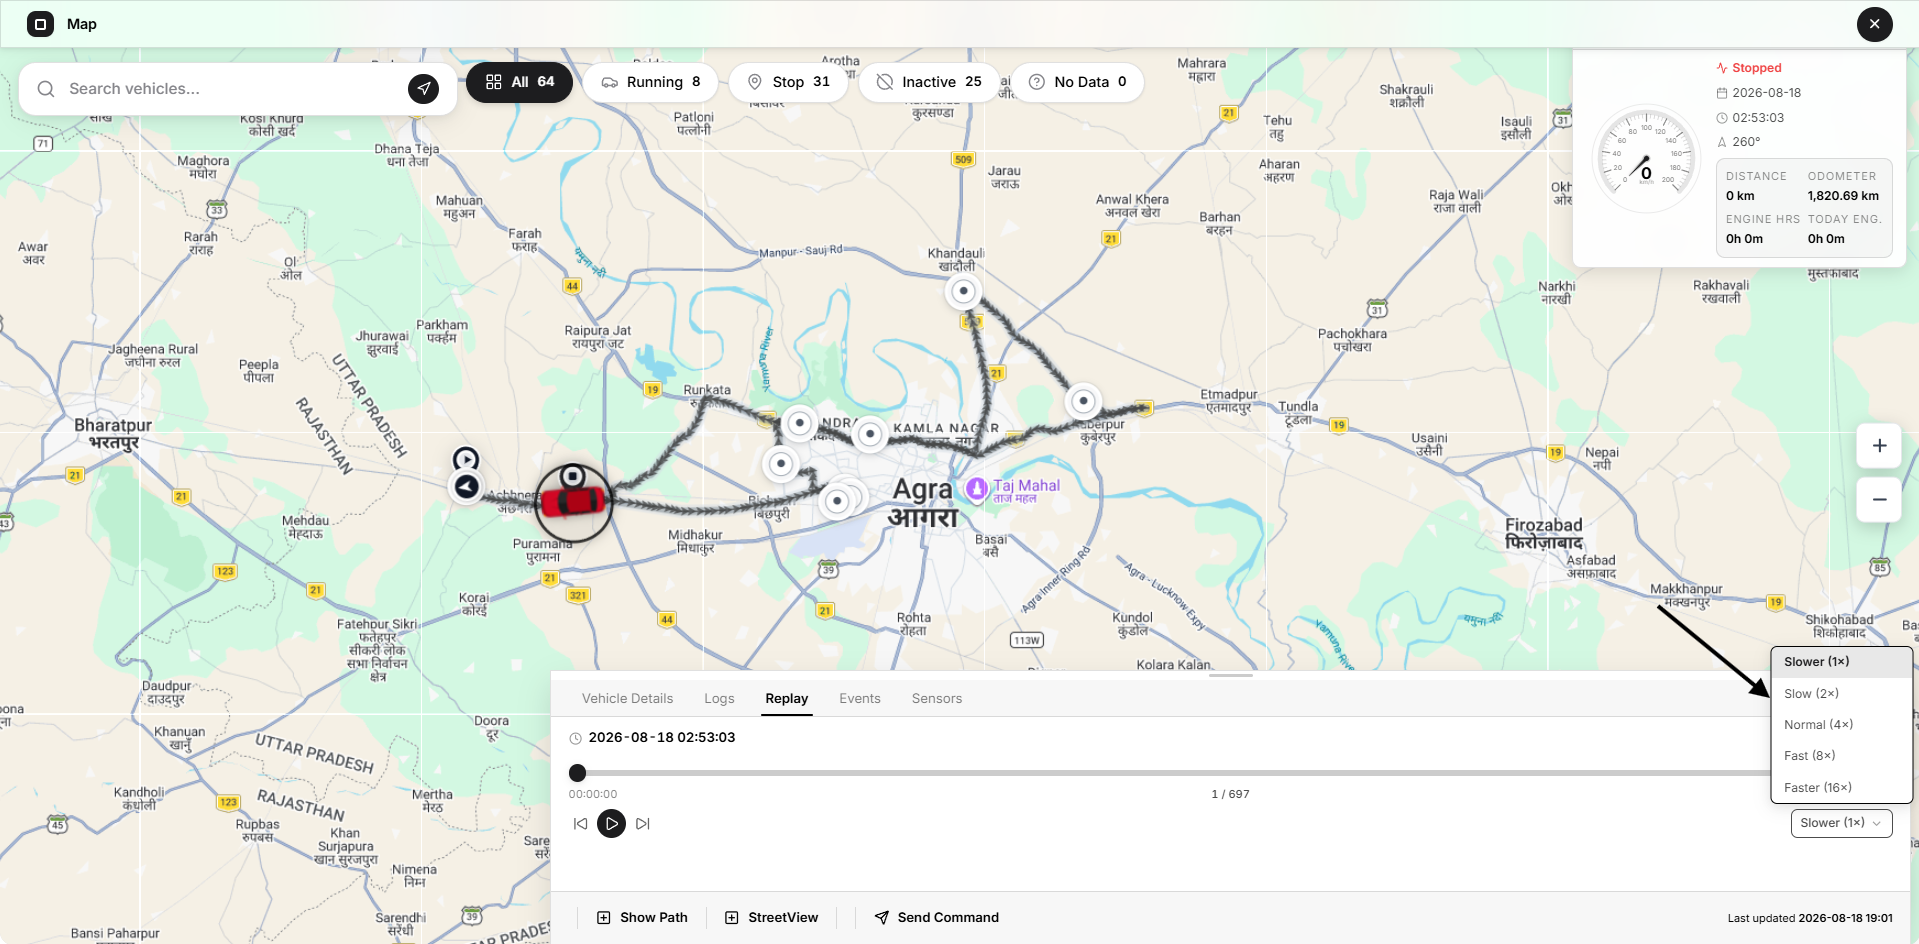
The available speeds are:
- Slower — 1×
- Slow — 2×
- Normal — 4×
- Fast — 8×
- Faster — 16×
The speed changes how quickly Open VTS advances between telemetry points. It does not change the historical speed values recorded by the GPS device.
Replay HUD
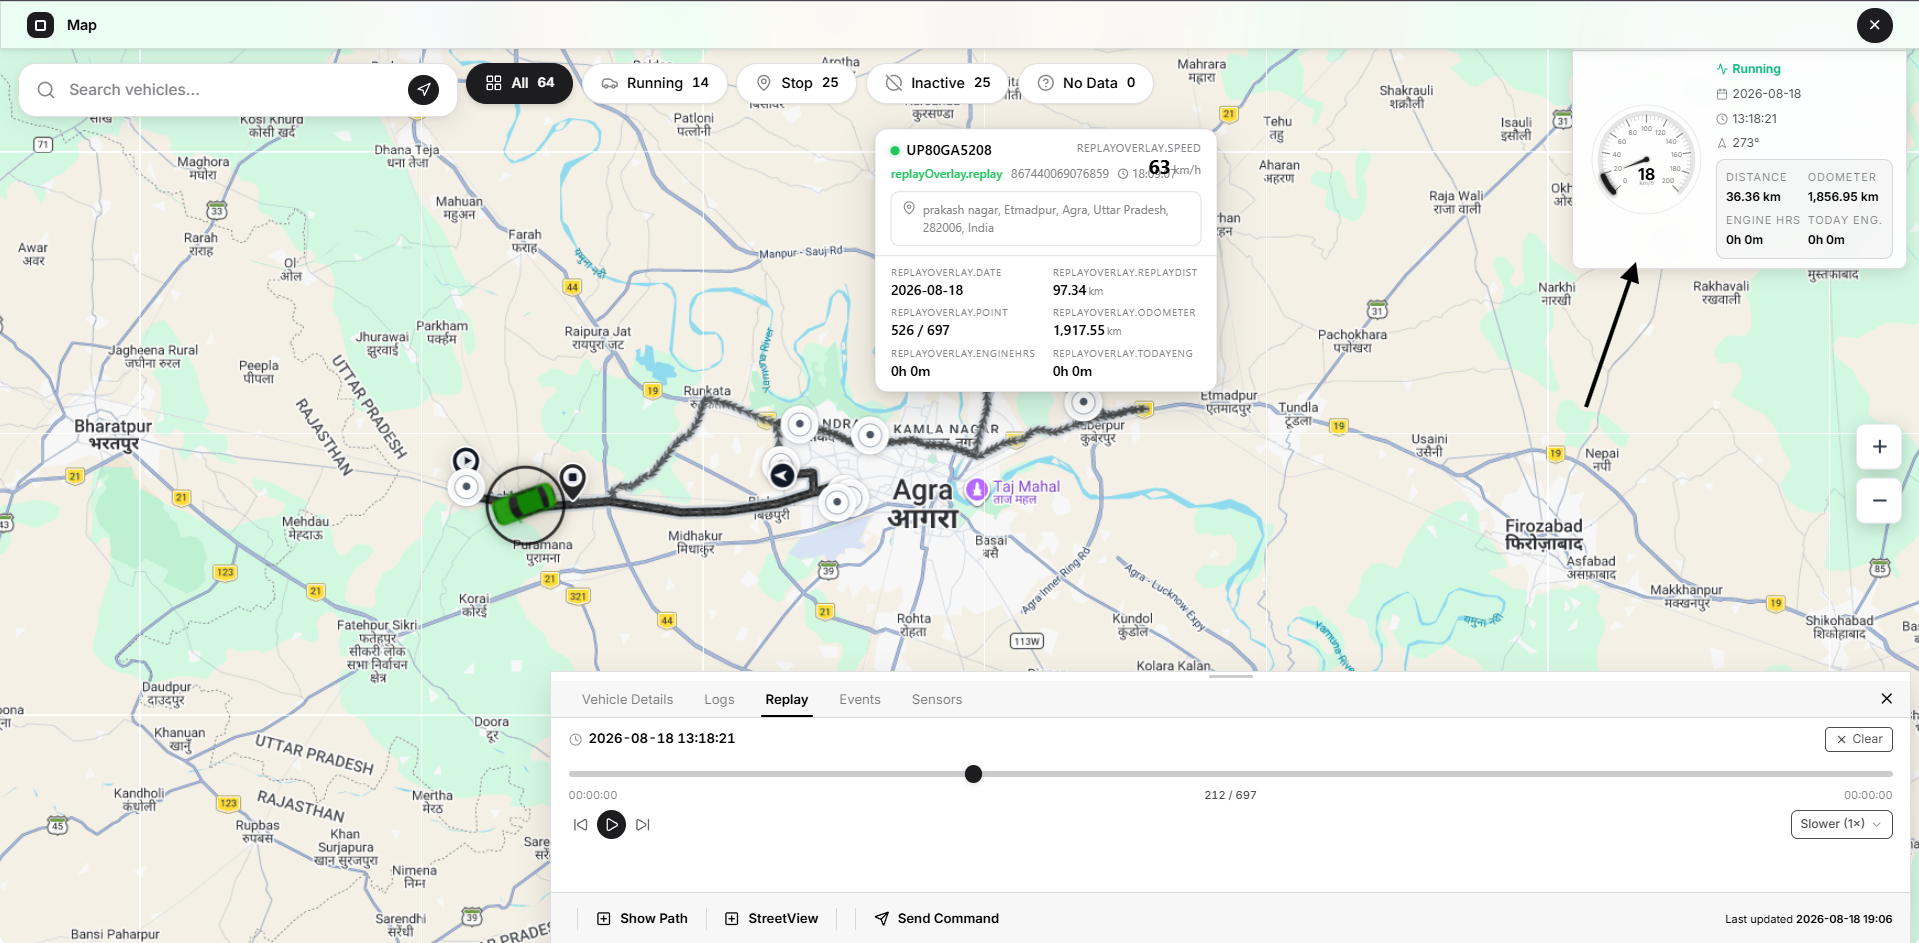
The Replay HUD shows information for the current historical point.
It can display:
- Replay point number
- Speedometer
- Historical movement state
- Historical date
- Historical time
- Course
- Historical address
- Distance travelled within the replay
- Odometer
- Engine hours
- Engine hours accumulated during the replay period
Replay values are historical and should not be interpreted as the vehicle’s current live values.
Select Clear or close the Replay HUD to stop Replay and remove the route.
Events Tab
The Events tab shows alert and event records for the currently selected vehicle.
Each event entry can include:
- Severity icon
- Event title
- Message
- Date and time
Examples include:
- Geofence Entry
- Geofence Exit
- Overspeed detected
The Events tab and the left-panel Alerts tab use the same underlying map-event system, but they provide different scopes:
- Alerts: Platform or selected-vehicle monitoring from the left panel
- Events: Event history for the vehicle currently open in the bottom panel
Events are sorted with the newest records first.
When more event records are available, select Load older events to retrieve the next page.
If the selected vehicle has no events, the tab displays an empty state.
Sensors Tab
The Sensors tab shows calculated sensor values for the selected vehicle after sensors have been configured.
In the current deployment, no sensors are configured, so the tab displays the sensor empty state.
When configured, the tab can show:
- Sensor name
- Current computed value
- Unit
- Sensor type
- Description
- Telemetry timestamp
- Sensor count
- Calculation error, when applicable
The Sensors tab provides:
- Refresh: Reload current sensor values
- Auto: Periodically refresh when new vehicle telemetry is available
Sensor values depend on:
- Sensor definitions
- Required telemetry attributes
- Sensor computation logic
- Incoming data from the GPS device
Detailed sensor-card documentation should be updated after production sensor configurations are available.
Trip History
The main History tab in the left panel provides route analysis for a selected period.
History is different from Replay:
- Replay animates individual telemetry points.
- History converts the journey into operational segments and analytics.
Configure Trip History
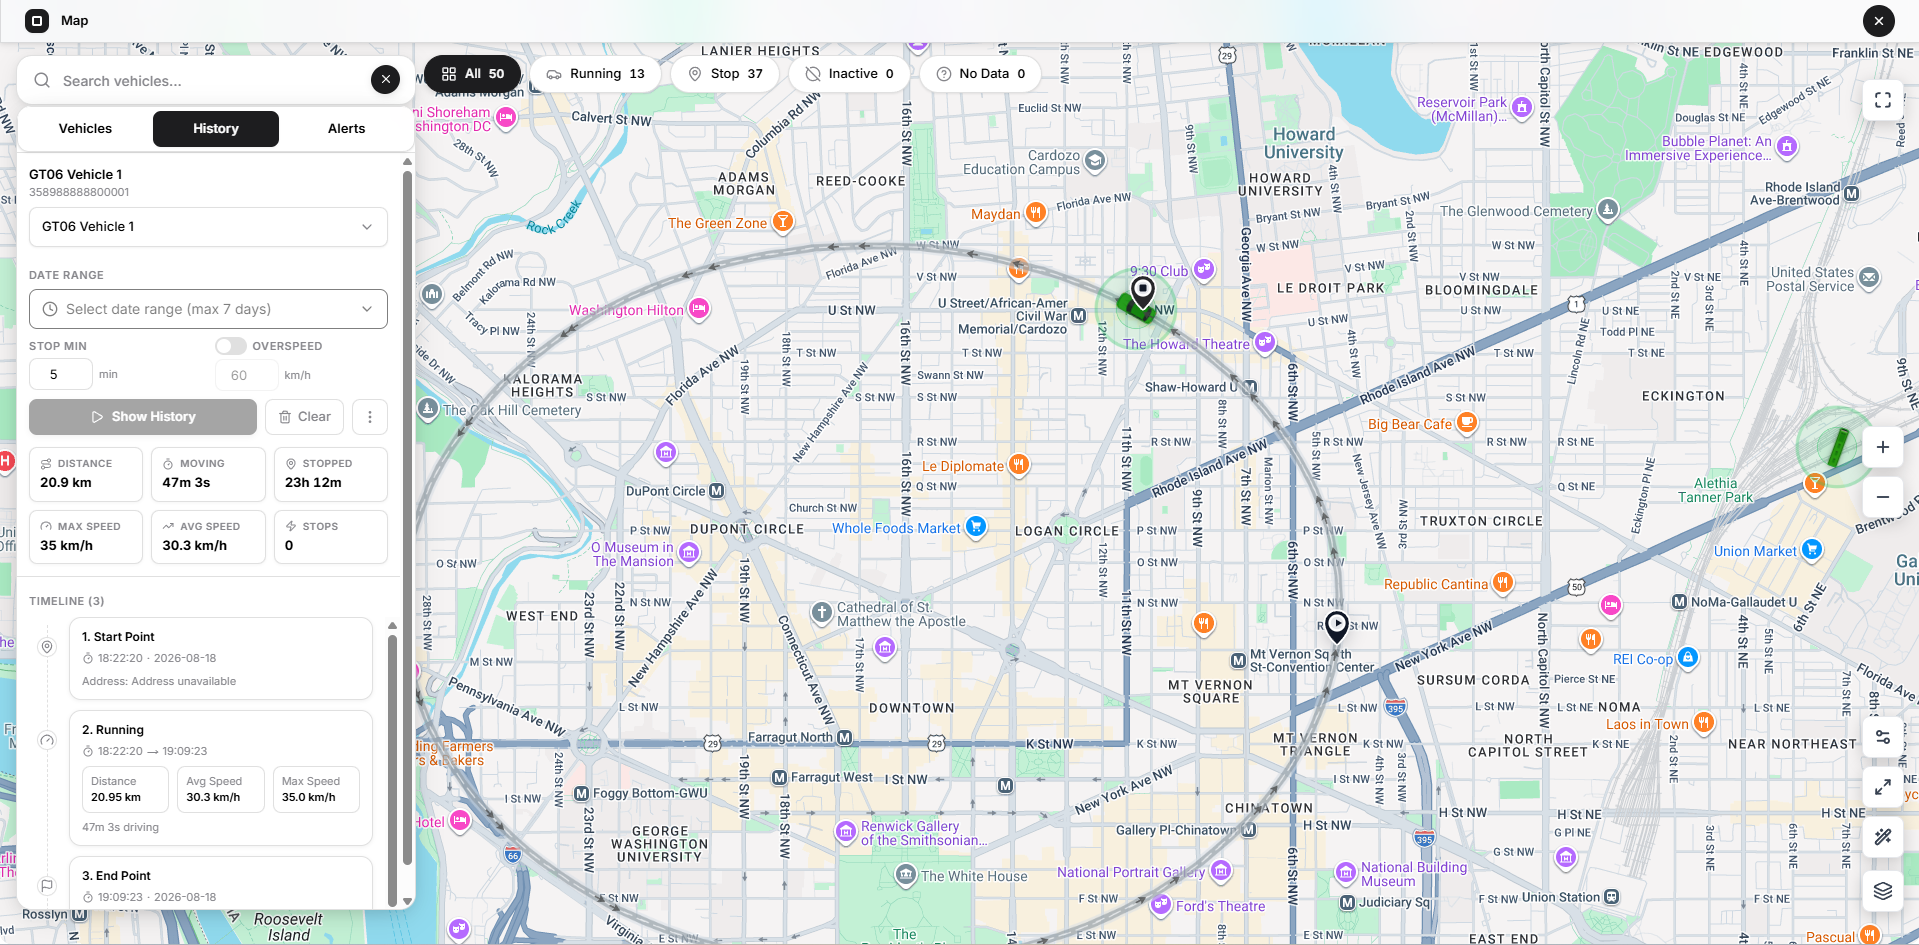
To load History:
- Select a vehicle.
- Select a date and time range.
- Set the minimum stop duration.
- Enable Overspeed when required.
- Enter the overspeed threshold.
- Select Show History.
Only one vehicle can be analyzed at a time.
The selected vehicle’s name and IMEI appear above the selector.
History Date Range
The selector provides these presets:
- Last Hour
- Last 3 Hours
- Last 6 Hours
- Last 12 Hours
- Last 24 Hours
- Today
- Yesterday
- This Week
- Last Week
- Last 7 Days
- Last 30 Days
- Custom
A single Superadmin History request is limited to a maximum of 7 days.
A preset longer than seven days cannot be processed as one History request. Use shorter periods when reviewing longer operations.
Stop Minimum
Stop Min defines how long a stationary period must continue before it is analyzed as a stop.
The accepted field range is 1–120 minutes.
Example: 5 minutes
The selected value affects:
- Stopped time
- Stops count
- Stop segments
- Stop markers
- Timeline structure
Very short stationary segments may not be displayed as separate timeline markers in the current Map presentation.
Overspeed
Enable Overspeed to analyze speed-threshold violations.
Enter the threshold in kilometres per hour.
The accepted field range is 10–250 km/h.
Example: 60 km/h
When enabled, Open VTS returns overspeed segments separately and highlights those route portions in the History overlay.
Load History
Select Show History.
When data is available, Open VTS:
- Draws the complete route
- Shows start and end markers
- Shows direction arrows
- Shows stop markers
- Displays overspeed sections when enabled
- Fits the Map around the route
- Calculates analytics
- Creates a chronological timeline
- Enables Clear and Export
History can load a large number of telemetry points. Long routes and multi-day periods may require more time than short ranges.
History Analytics
The History panel shows six summary values.
Distance
Total calculated distance travelled during the selected range.
Moving
Total time classified as vehicle movement.
Stopped
Total time classified as stopped.
Max Speed
Highest speed recorded in the loaded History.
Avg Speed
Average speed while the vehicle was classified as moving.
Stops
Number of stop periods found in the selected range.
These values apply only to the selected History range. They are not the lifetime totals of the vehicle.
History Route
The route uses a neutral road-style path so that it remains readable over different basemaps.
The route can include:
- Complete path
- Direction arrows
- Start point
- End point
- Stop or idle points
- Overspeed segments
- Historical point tooltips
Direction arrows are placed across the route at intervals to communicate travel direction.
Hovering over a history point can show:
- Vehicle
- Segment type
- Time
- Speed
- Address
- IMEI
- Date
- Elapsed time
- Distance
- Point number
Stop-Marker Information
History stop markers represent stationary periods.
A stop tooltip or popup can show:
- Stop or idle classification
- Duration
- Start date and time
- End date and time
- Address
- Coordinates
The address is loaded from the marker’s coordinates. If reverse geocoding is unavailable, the coordinates remain visible.
History Timeline
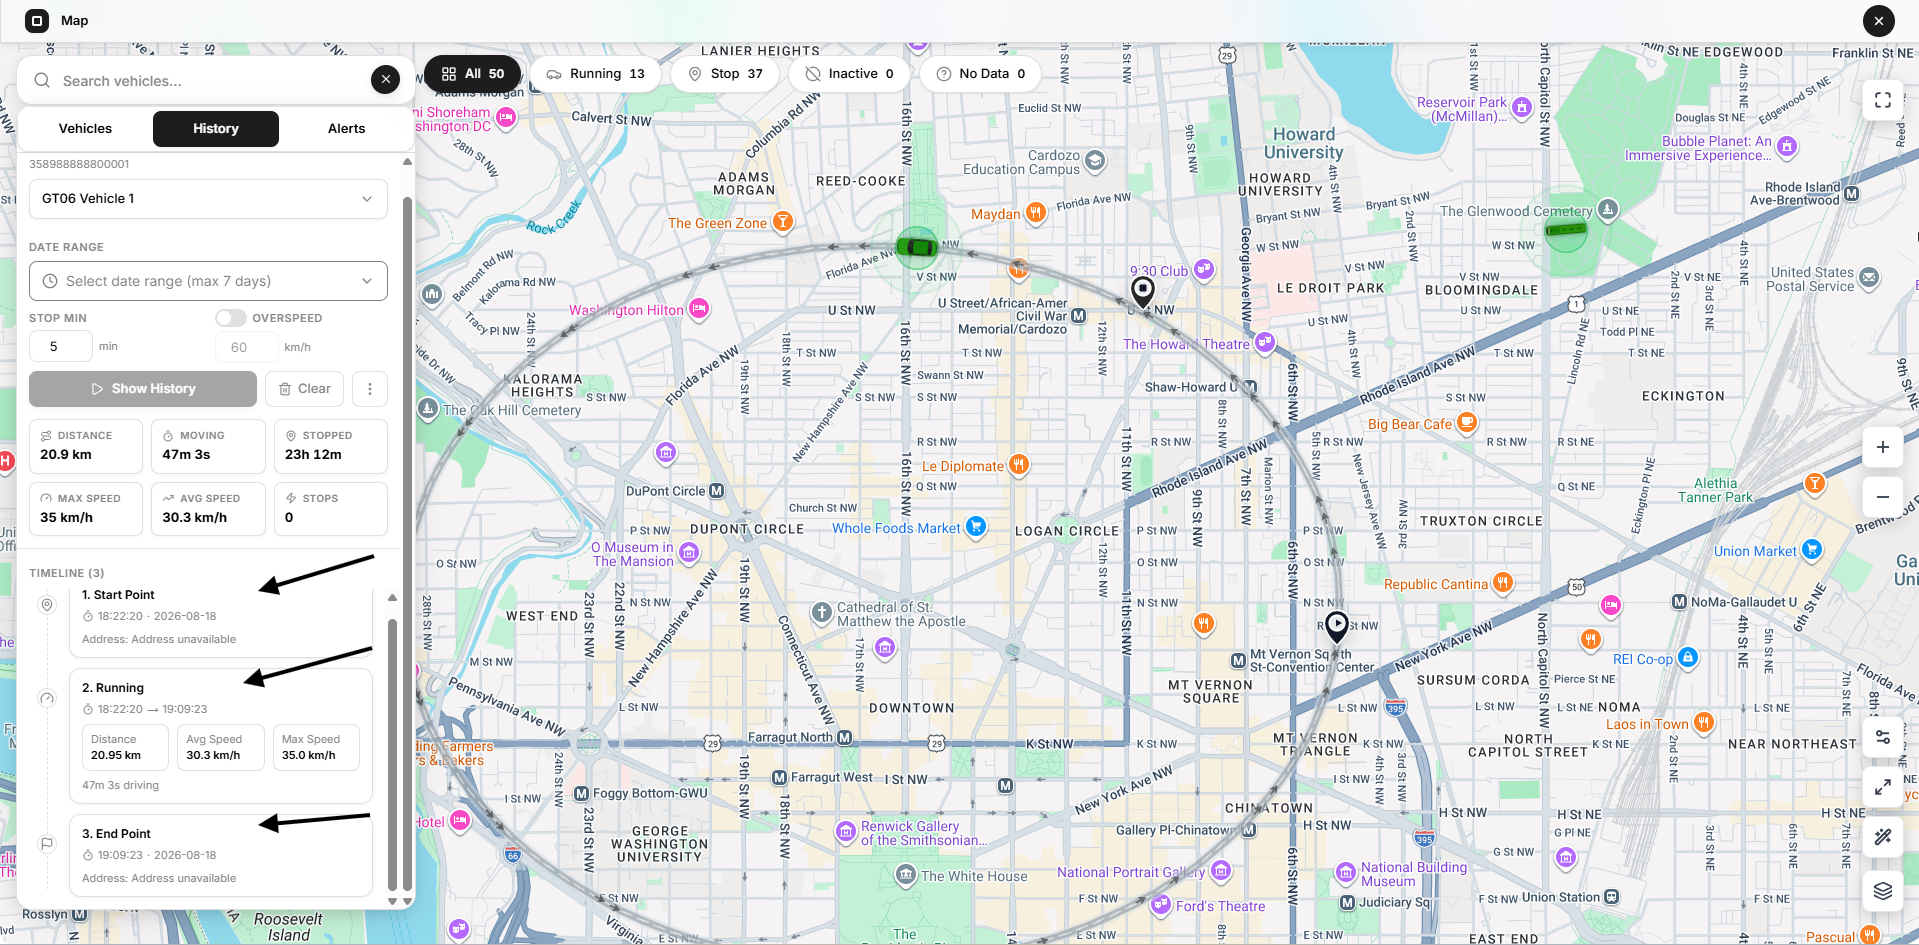
The Timeline converts the route into an ordered operational sequence.
The timeline can contain:
- Start Point
- Running
- Stop
- End Point
Start Point
Shows:
- Start time
- Start date
- Address, when available
Running
Shows:
- Start time
- End time
- Distance
- Average speed
- Maximum speed
- Driving duration
Consecutive driving segments can be grouped into one Running entry.
Stop
Shows:
- Start time
- End time
- Duration
- Address
- Engine-off or short-halt label
Longer stop periods can be labelled Engine off. Shorter qualifying stops can be labelled Short halt.
End Point
Shows:
- End time
- End date
- Address, when available
Select a Timeline Segment
Select a Start, Running, Stop, or End timeline entry.
Open VTS then:
- Marks the timeline item as selected
- Highlights the corresponding route or point
- Fits the Map around the selected segment or position
Use this to move quickly through a long multi-day History route.
Export History
Open the three-dot menu after History has loaded.
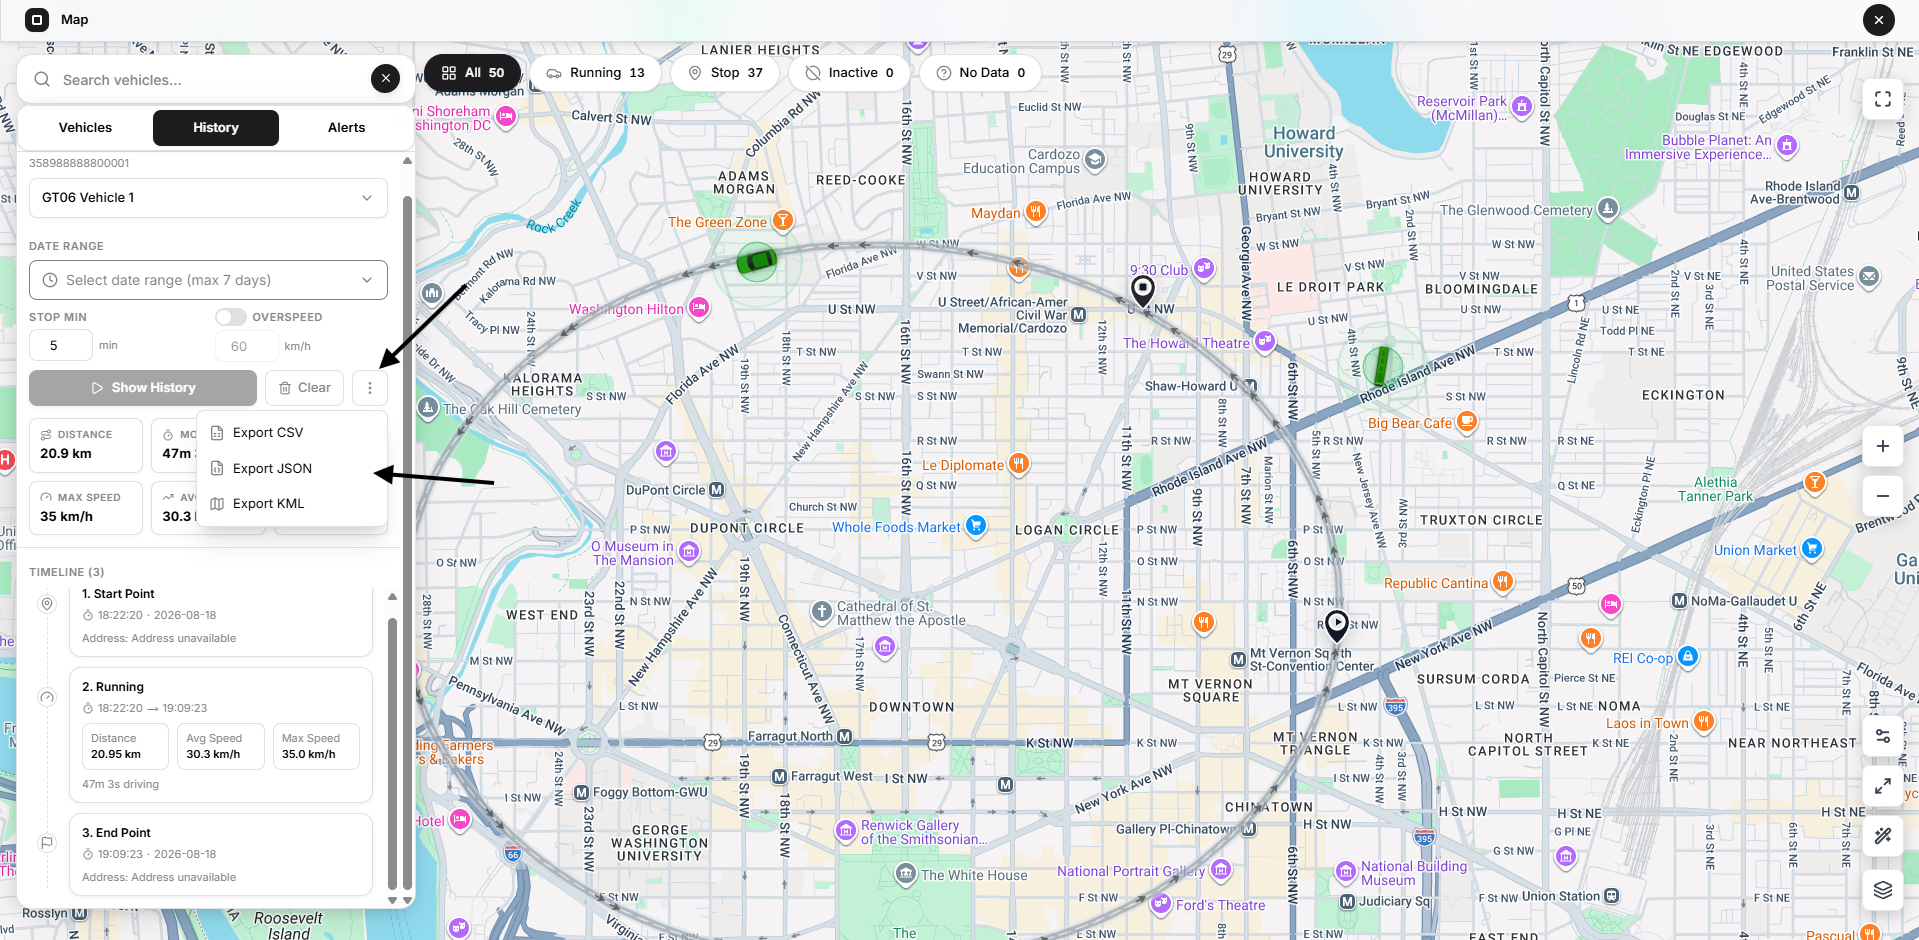
The available formats are:
- CSV
- JSON
- KML
CSV
Suitable for spreadsheet analysis.
JSON
Suitable for integrations and technical processing.
KML
Suitable for compatible mapping and geographic applications.
History exports can contain detailed locations, timestamps, IMEIs, vehicle identities, and operational patterns. Store and share them securely.
The Superadmin History workflow does not include Save as Route. That option belongs to the User-level route workflow.
Clear History
Select Clear to remove:
- History route
- Markers
- Direction arrows
- Overspeed display
- Analytics
- Timeline
- Export state
The panel returns to the setup state.
Alerts Tab
The Alerts tab displays recent platform map events.
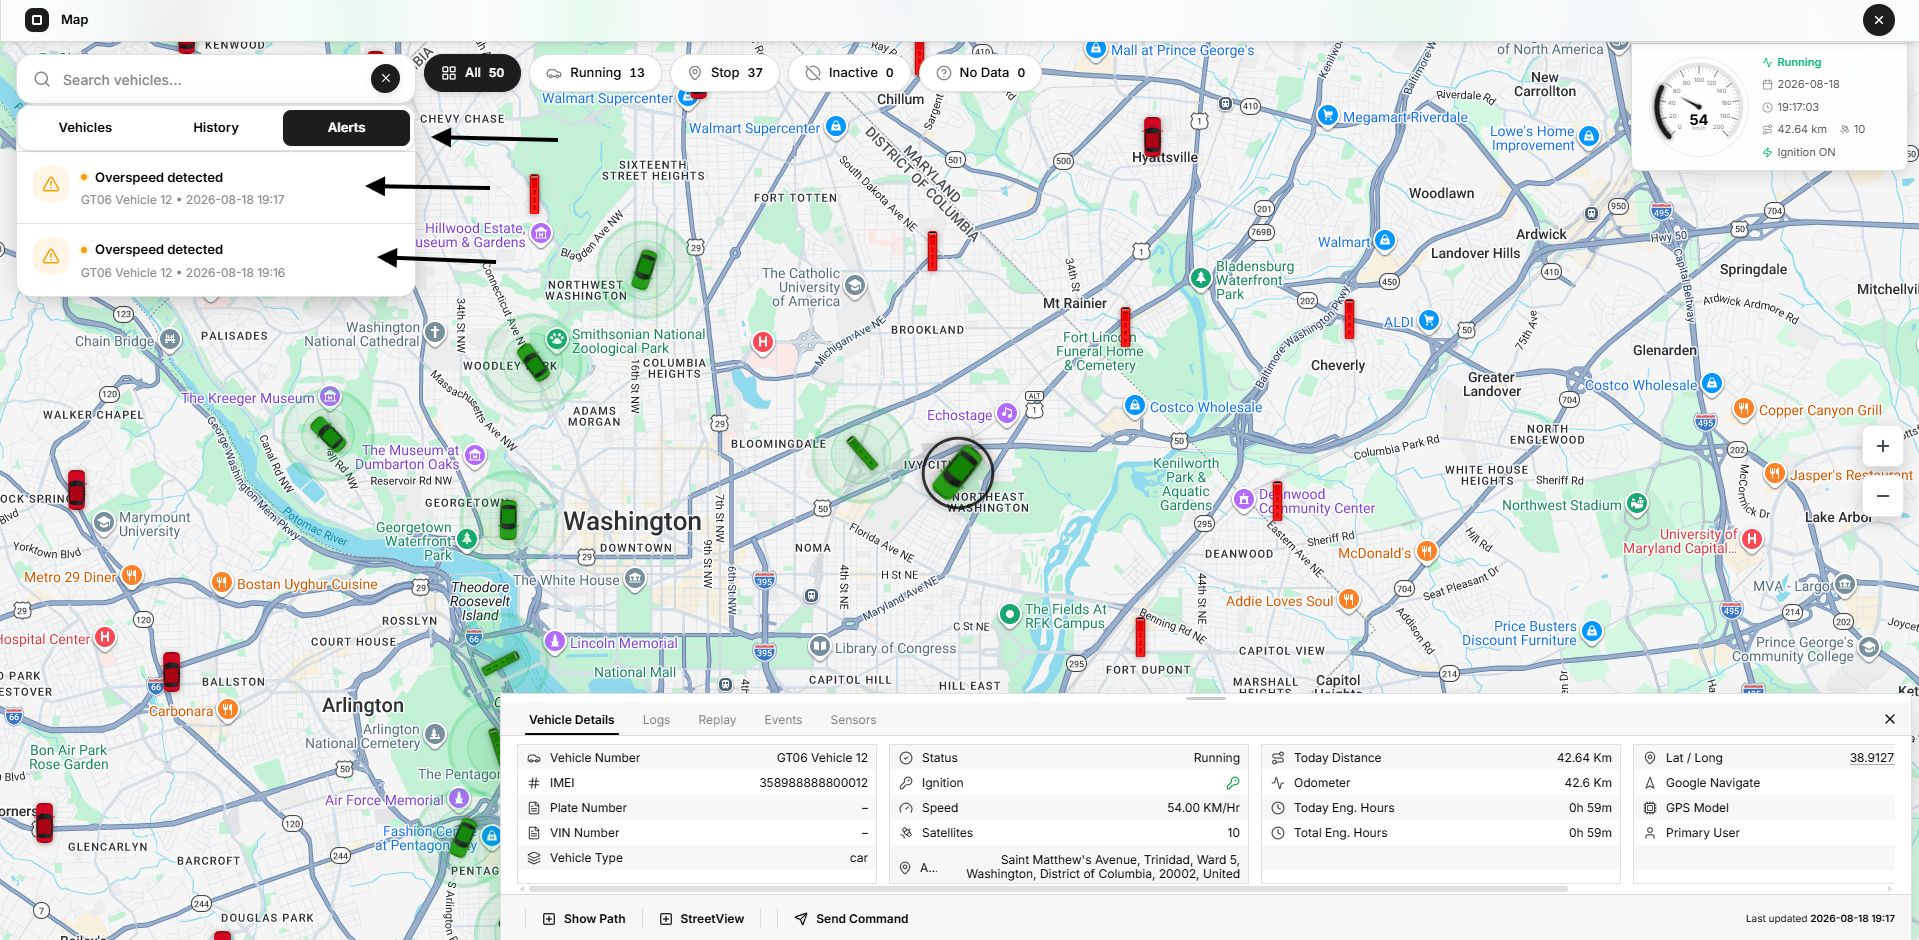
Each alert row shows:
- Severity icon
- Alert title
- Vehicle
- Date and time
Confirmed examples include:
- Overspeed detected
- Geofence Exit
- Geofence Entry
Alerts are sorted newest first.
The platform initially loads a recent page and can retain a larger rolling list while new real-time events arrive.
Alert Severity
Alerts can use these severity levels:
- Info: Informational vehicle event
- Warning: Event requiring operational attention
- Critical: High-priority event
The icon and colour help distinguish severity when scanning the list.
Search Alerts
While the Alerts tab is active, use the main Map search field to match:
- Alert title
- Vehicle name
- IMEI
When a vehicle is already selected, the Alerts tab is automatically scoped to that vehicle.
Clear the selected vehicle to return to the platform-wide alert feed.
Select an Alert
Select an alert to:
- Close the left alert panel
- Select the associated vehicle
- Focus the Map on the vehicle
- Open the vehicle workspace
This allows the Superadmin to move from an alert directly to the relevant live and historical vehicle information.
If no records match the selected vehicle or search query, Open VTS displays a No alerts found state.
Fullscreen
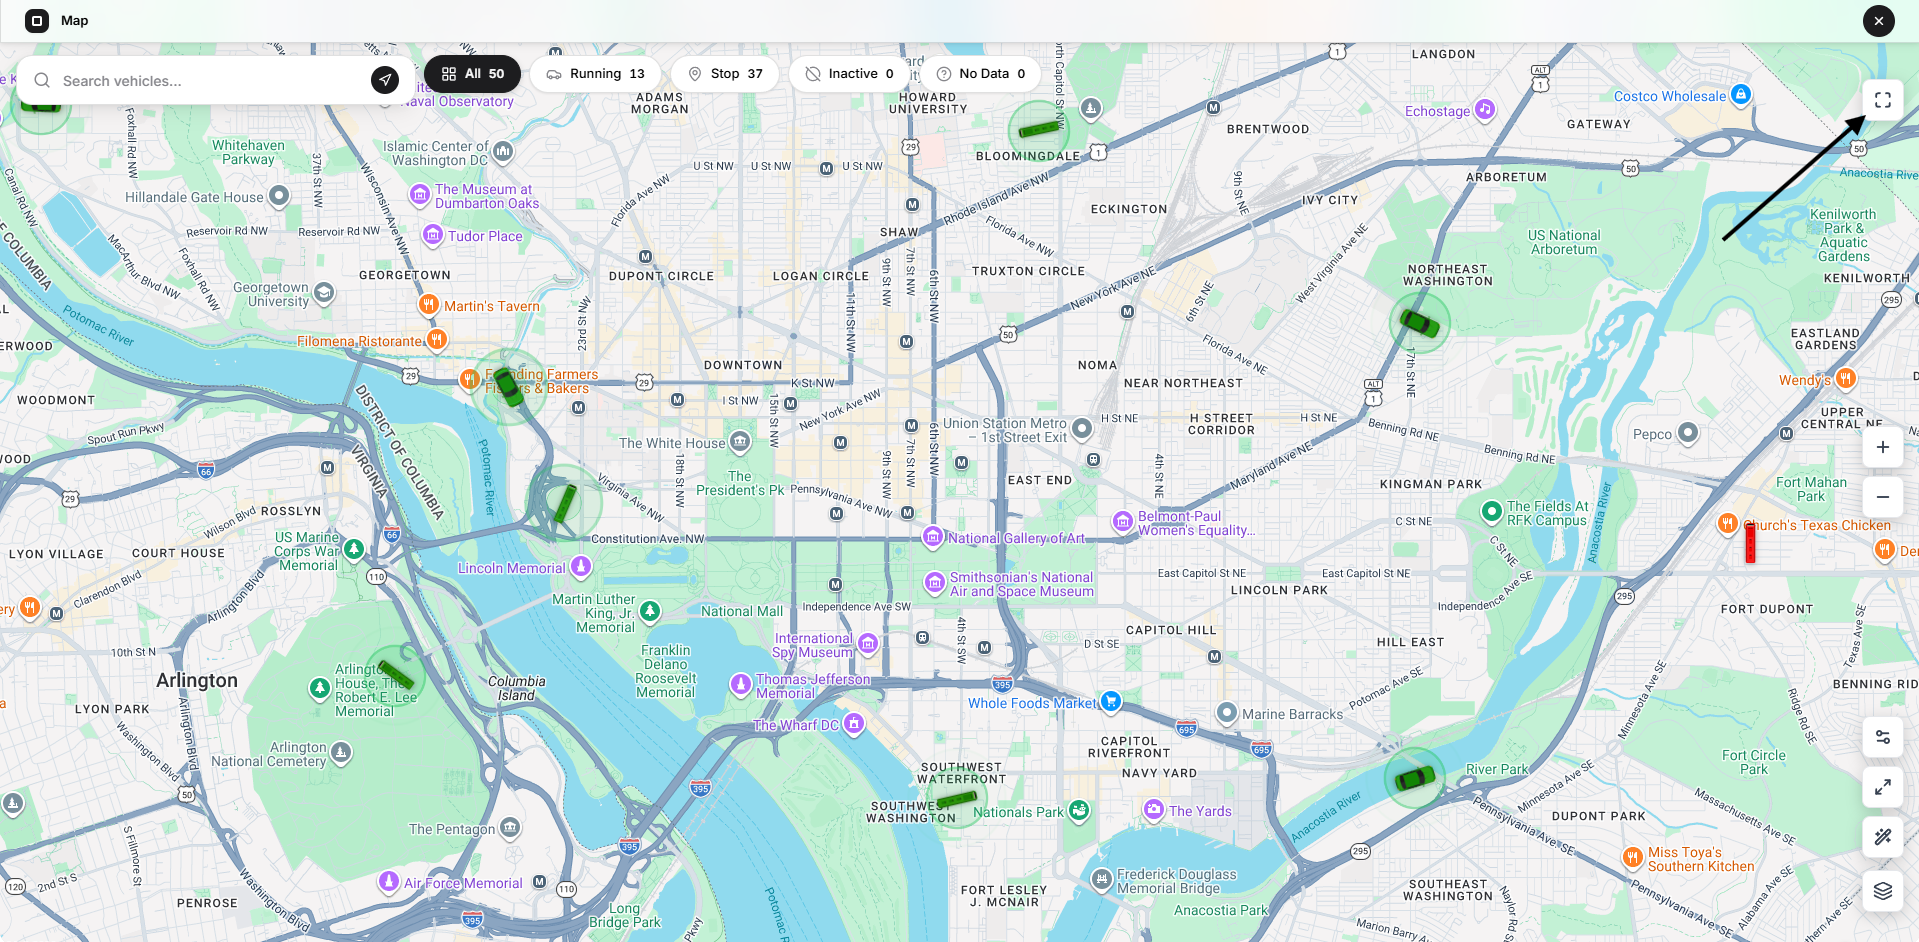
Select the Fullscreen control near the upper-right corner of the Map.
Fullscreen expands the Map container using the browser’s fullscreen mode.
It is useful for:
- Large fleet monitoring
- Trip History
- Replay
- Route comparison
- Operations-centre displays
Exit using the same control or the browser’s standard fullscreen exit action.
Fullscreen enlarges the workspace. It does not change the geographic zoom.
Zoom In and Zoom Out
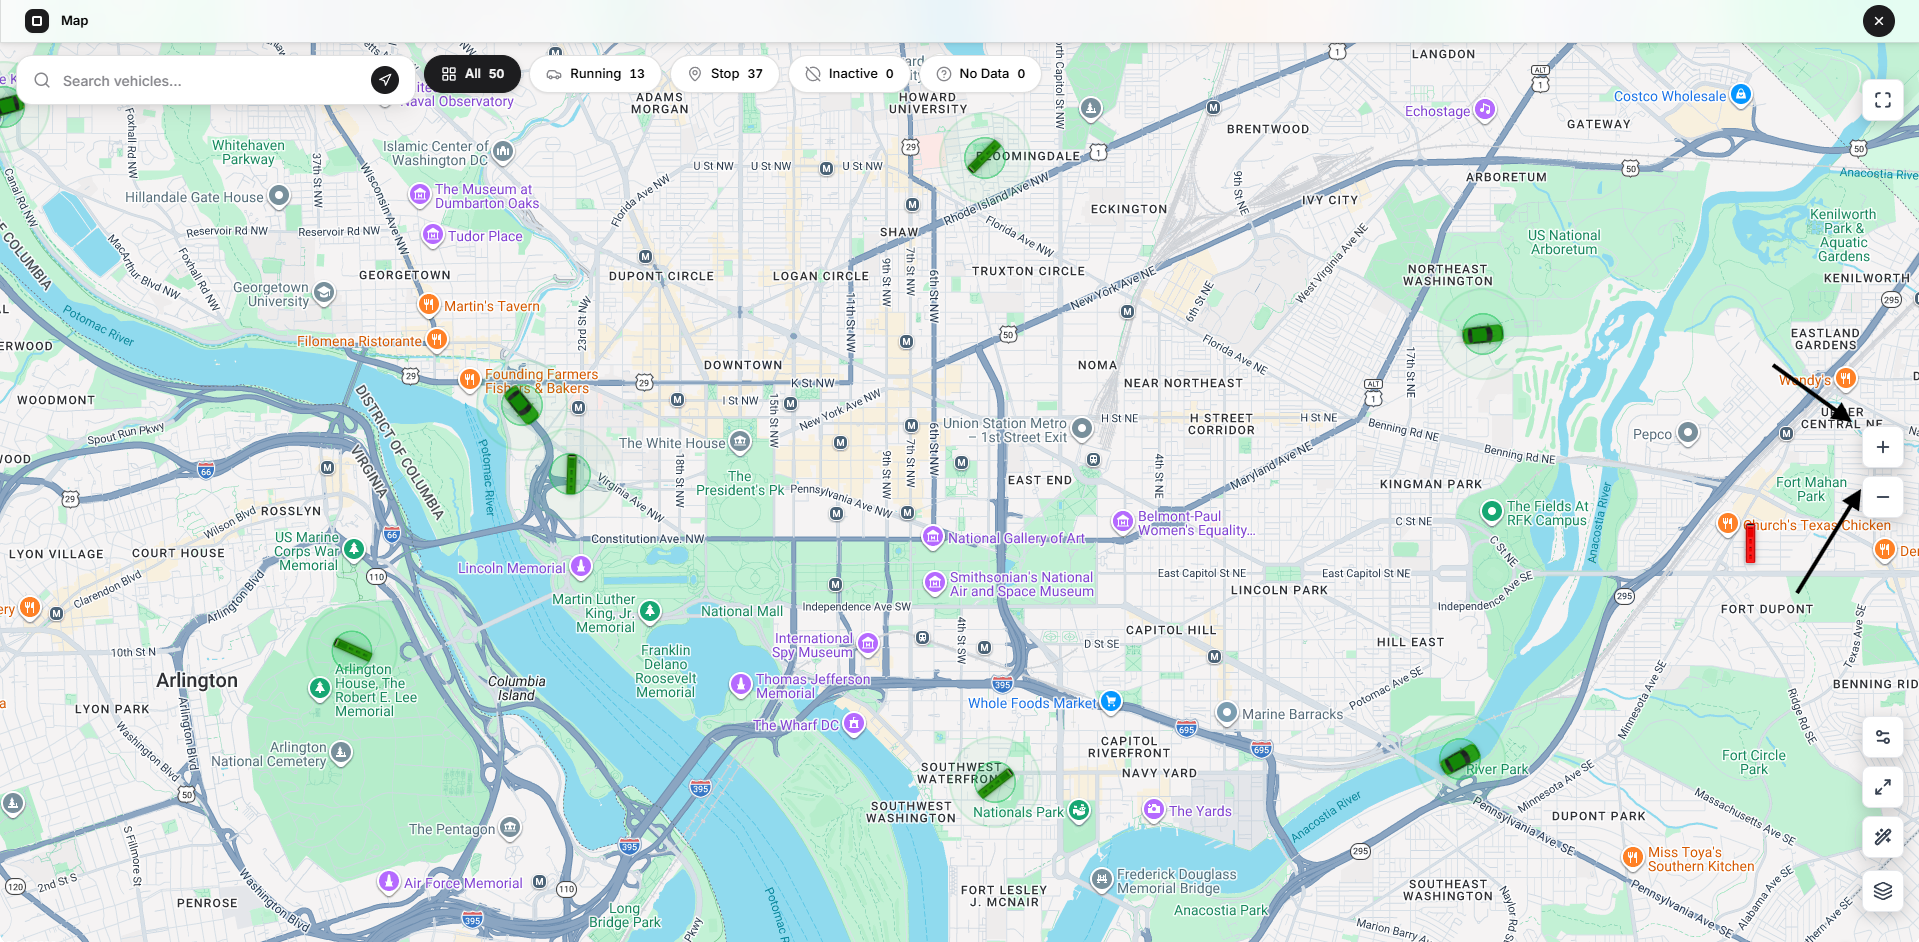
Use:
- + to zoom in
- − to zoom out
Zooming changes the geographic scale only.
Use Zoom In to inspect a smaller area in detail. Use Zoom Out to review a wider region.
Fit All Vehicles
Select the Fit All Vehicles control to adjust the Map around all available vehicle markers.
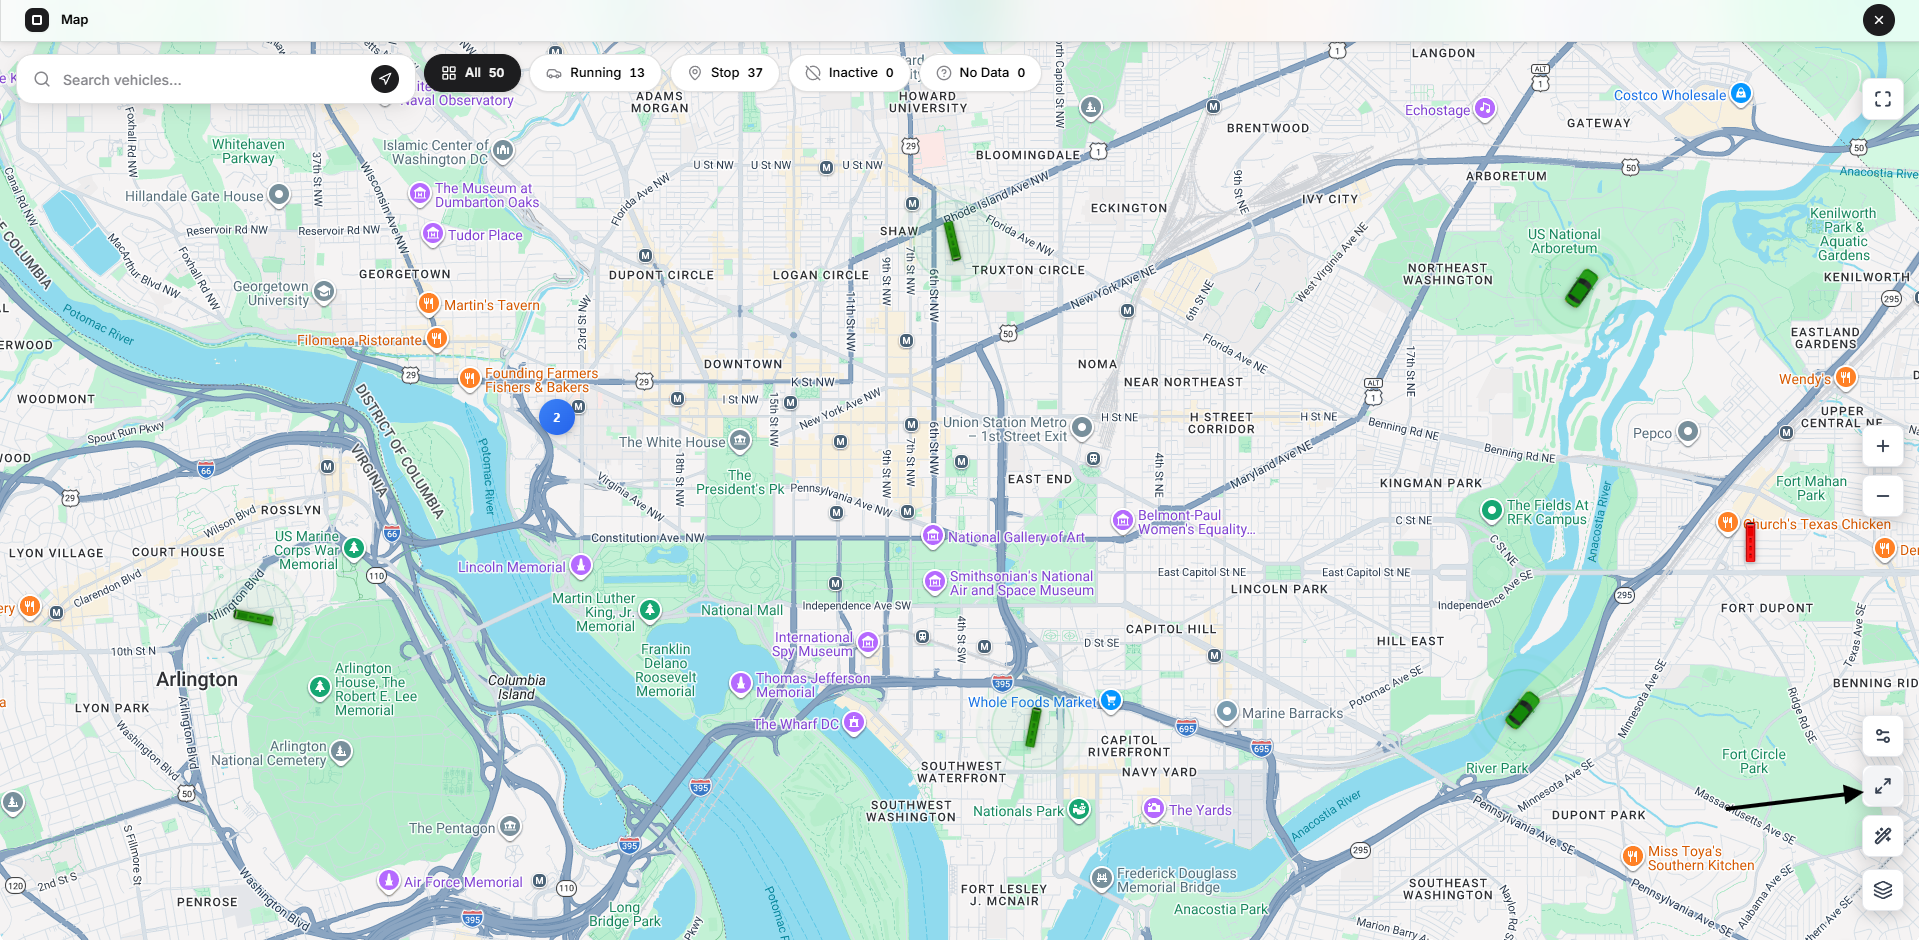
This is useful after:
- Inspecting one selected vehicle
- Panning away from the fleet
- Reviewing a local History route
- Opening the Map with vehicles distributed across several regions
Fit All Vehicles considers markers with valid coordinates.
It differs from Fullscreen:
- Fullscreen: Changes the size of the Map on the screen
- Fit All Vehicles: Changes the geographic centre and zoom
The Map also performs an initial fit after the first valid marker data becomes available.
Map Settings
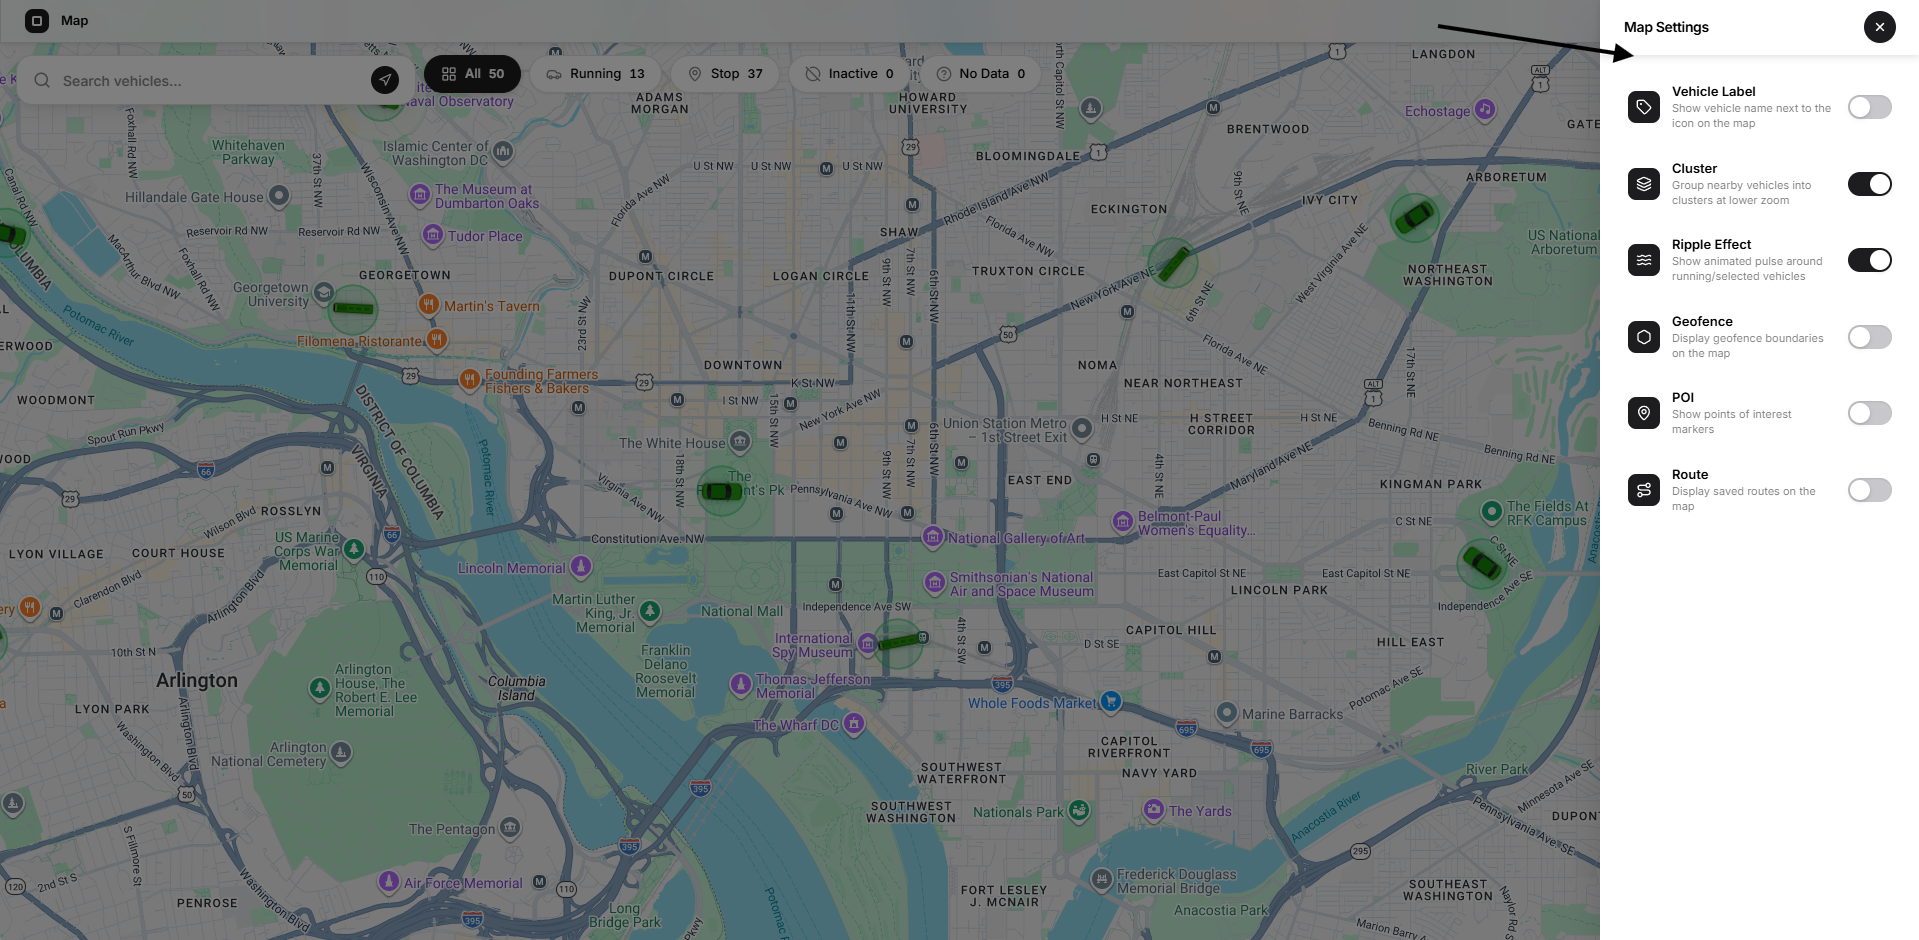
Select the adjustments icon to open Map Settings.
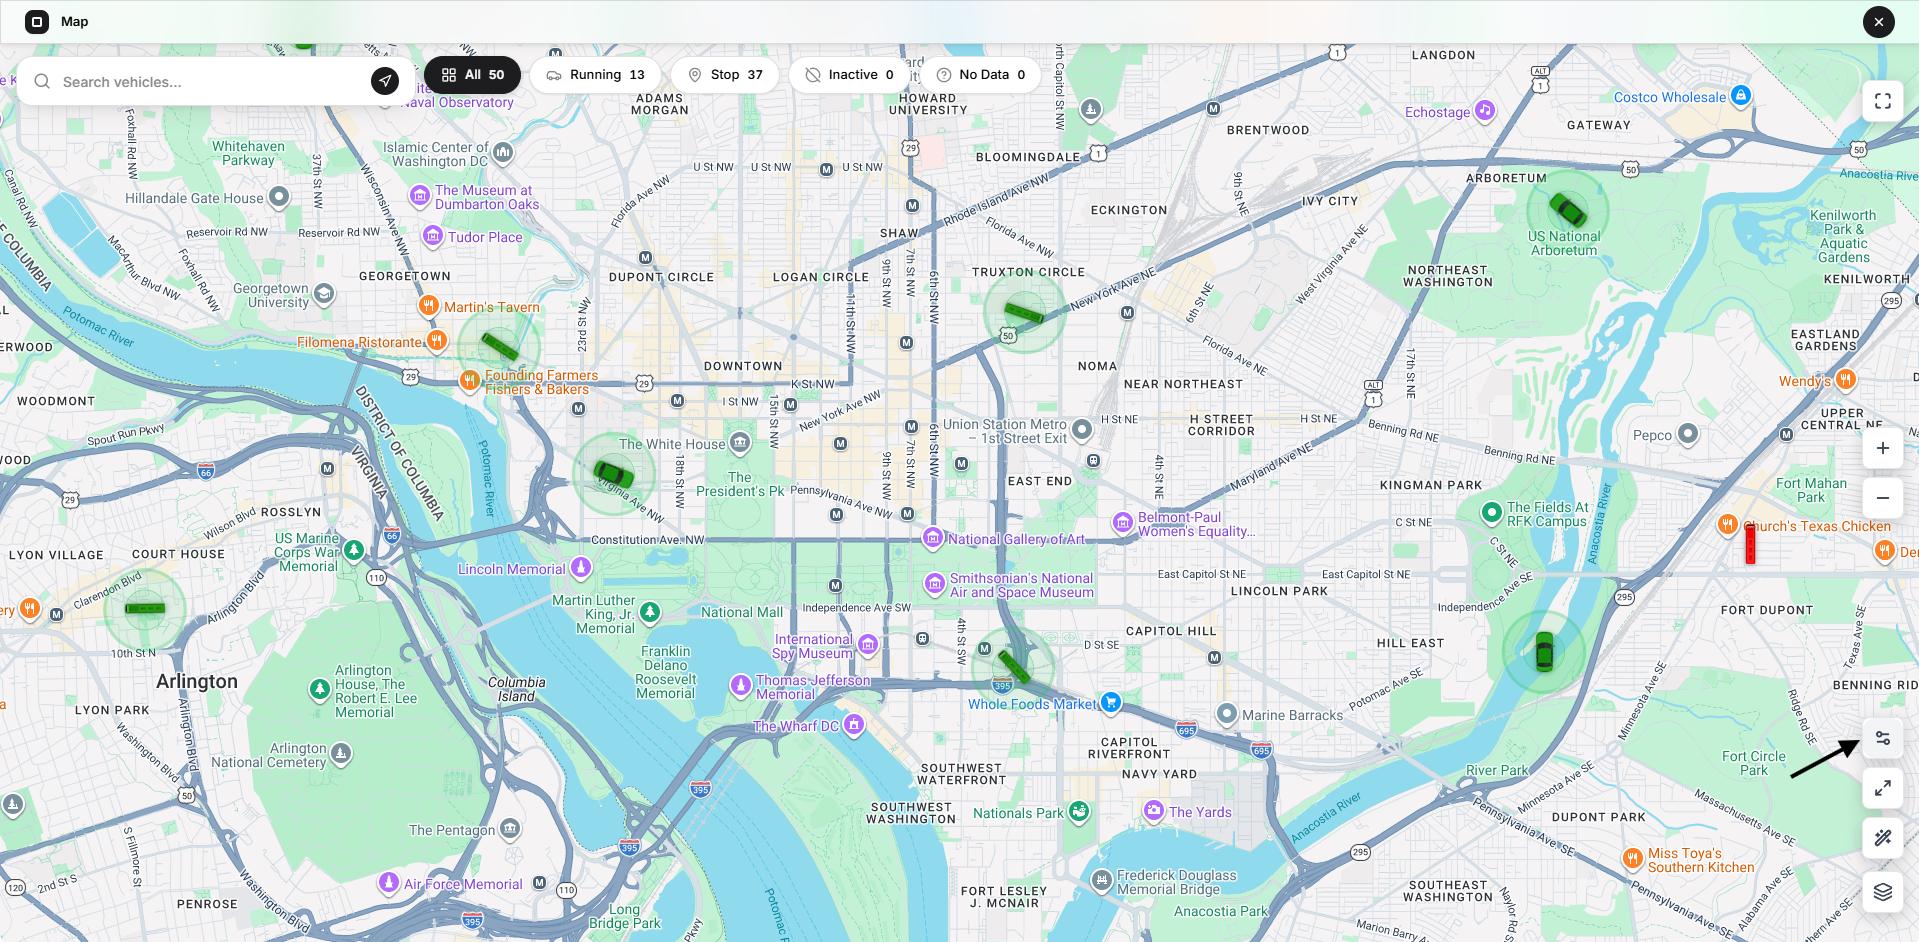
Available settings are:
- Vehicle Label
- Cluster
- Ripple Effect
- Geofence
- POI
- Route
Map Settings are saved in the current browser. Opening Open VTS in a different browser, browser profile, or device may use the default settings.
The default Superadmin Map settings are:
- Vehicle Label: Off
- Cluster: Off
- Ripple Effect: On
- Geofence: Off
- POI: Off
- Route: Off
Vehicle Label
Enable Vehicle Label to show the vehicle name next to its icon.
Vehicle Label is useful for identifying vehicles directly without selecting them.
Disable it when:
- Many vehicles overlap
- The Map is zoomed out
- Labels obscure roads or markers
- A cleaner monitoring view is preferred
The label uses the vehicle number or name rather than using the IMEI as the normal public label.
Cluster
Enable Cluster to group nearby vehicles.
A cluster marker displays the number of vehicles grouped in the area.
As the Map is zoomed in:
- Large clusters divide into smaller clusters
- Smaller clusters separate into individual markers
- Vehicles with identical or extremely close coordinates may remain grouped and can expand around the location
The currently selected vehicle remains individually visible outside the cluster.
Clustering is recommended for:
- Large fleets
- City-wide operations
- Platform-wide views
- Areas containing many vehicles at the same location
Ripple Effect
Enable Ripple Effect to display an animated pulse around a running vehicle.
In the current deployed behaviour, the effect is visibly applied to the green vehicle in motion.
Ripple Effect helps active movement stand out from stopped and inactive vehicles.
Disable it when monitoring a very large number of moving vehicles or when a calmer display is preferred.
Geofence Overlay
Enable Geofence to display saved geofence boundaries.
[Image Reference: Add the Geofence overlay screenshot here.]
The Map displays the boundaries according to the saved geofence shape and location.
Geofences can represent:
- Depots
- Customer locations
- Restricted areas
- Service zones
- Branch boundaries
- Delivery areas
Enabling Geofence only displays existing records. It does not create or edit a geofence.
If no geofence records exist, enabling the option produces no visible overlay.
The Map does not automatically refit when the overlay is enabled.
POI Overlay
Enable POI to show saved Points of Interest.
[Image Reference: Add the POI overlay screenshot here.]
POIs can represent:
- Offices
- Warehouses
- Customer sites
- Fuel stations
- Workshops
- Parking locations
- Operational checkpoints
POI markers help relate vehicle positions to important saved locations.
Enabling POI does not create a new Point of Interest.
Saved Route Overlay
Enable Route to display saved routes.
[Image Reference: Add the saved Route overlay screenshot here.]
Saved routes appear as route lines on the Map.
They can be used to:
- Review planned paths
- Compare vehicle positions with operating routes
- Display assigned delivery or service corridors
- Monitor route coverage
Saved Route is different from:
- Show Path
- Trip History
- Replay
Saved Route shows a predefined stored route. The other three features use actual telemetry received from a vehicle.
Visual Effects
Select the magic-wand control to open Visual Effects.
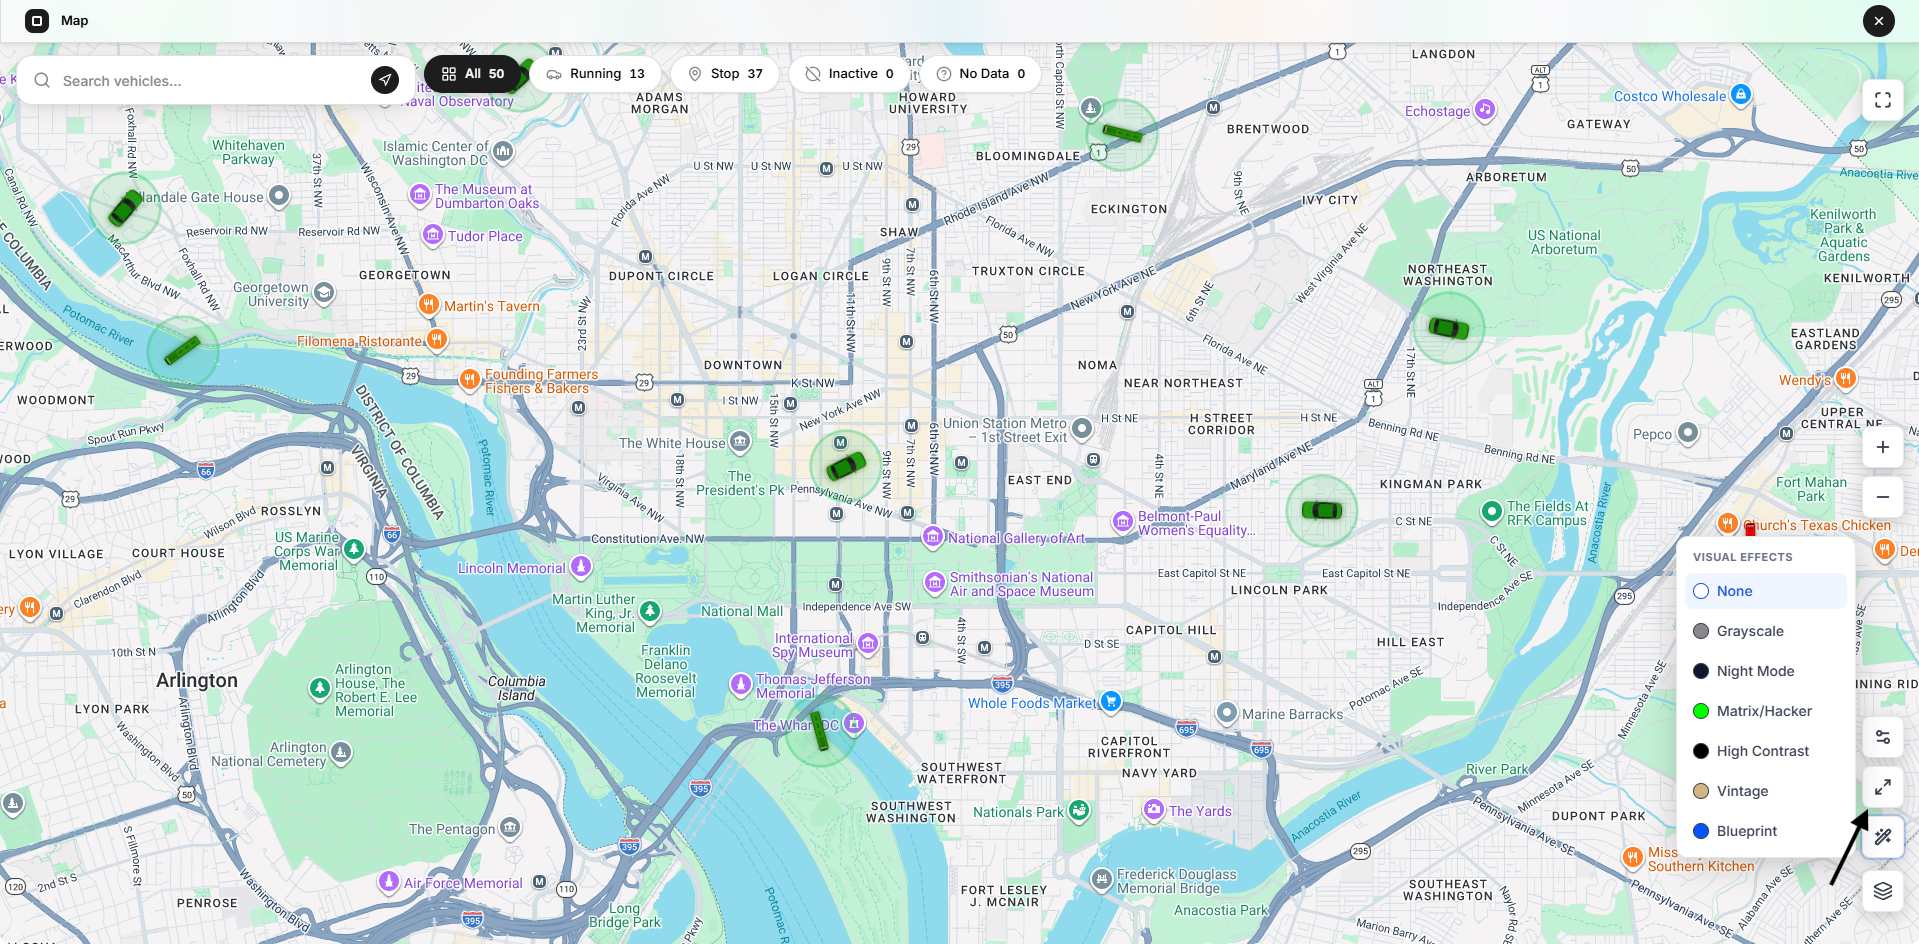
Available effects are:
- None
- Grayscale
- Night Mode
- Matrix/Hacker
- High Contrast
- Vintage
- Blueprint
Visual Effects apply to the basemap tiles. They do not change:
- Vehicle status
- Marker colours
- Coordinates
- Alerts
- History data
- Replay data
- Operational overlays
Only one effect can be active at a time.
None
Uses the normal basemap appearance.
Grayscale
Removes most basemap colour. This can make coloured markers and alerts more prominent.
Night Mode
Applies a darker, lower-brightness view for low-light monitoring.
Matrix/Hacker
Applies a strong green visual treatment.
High Contrast
Increases the contrast of the basemap.
Vintage
Applies a muted sepia-style appearance.
Blueprint
Applies a technical blue visual treatment.
Select None to remove the current effect.
Map Style
Select the layers control to open Map Style.
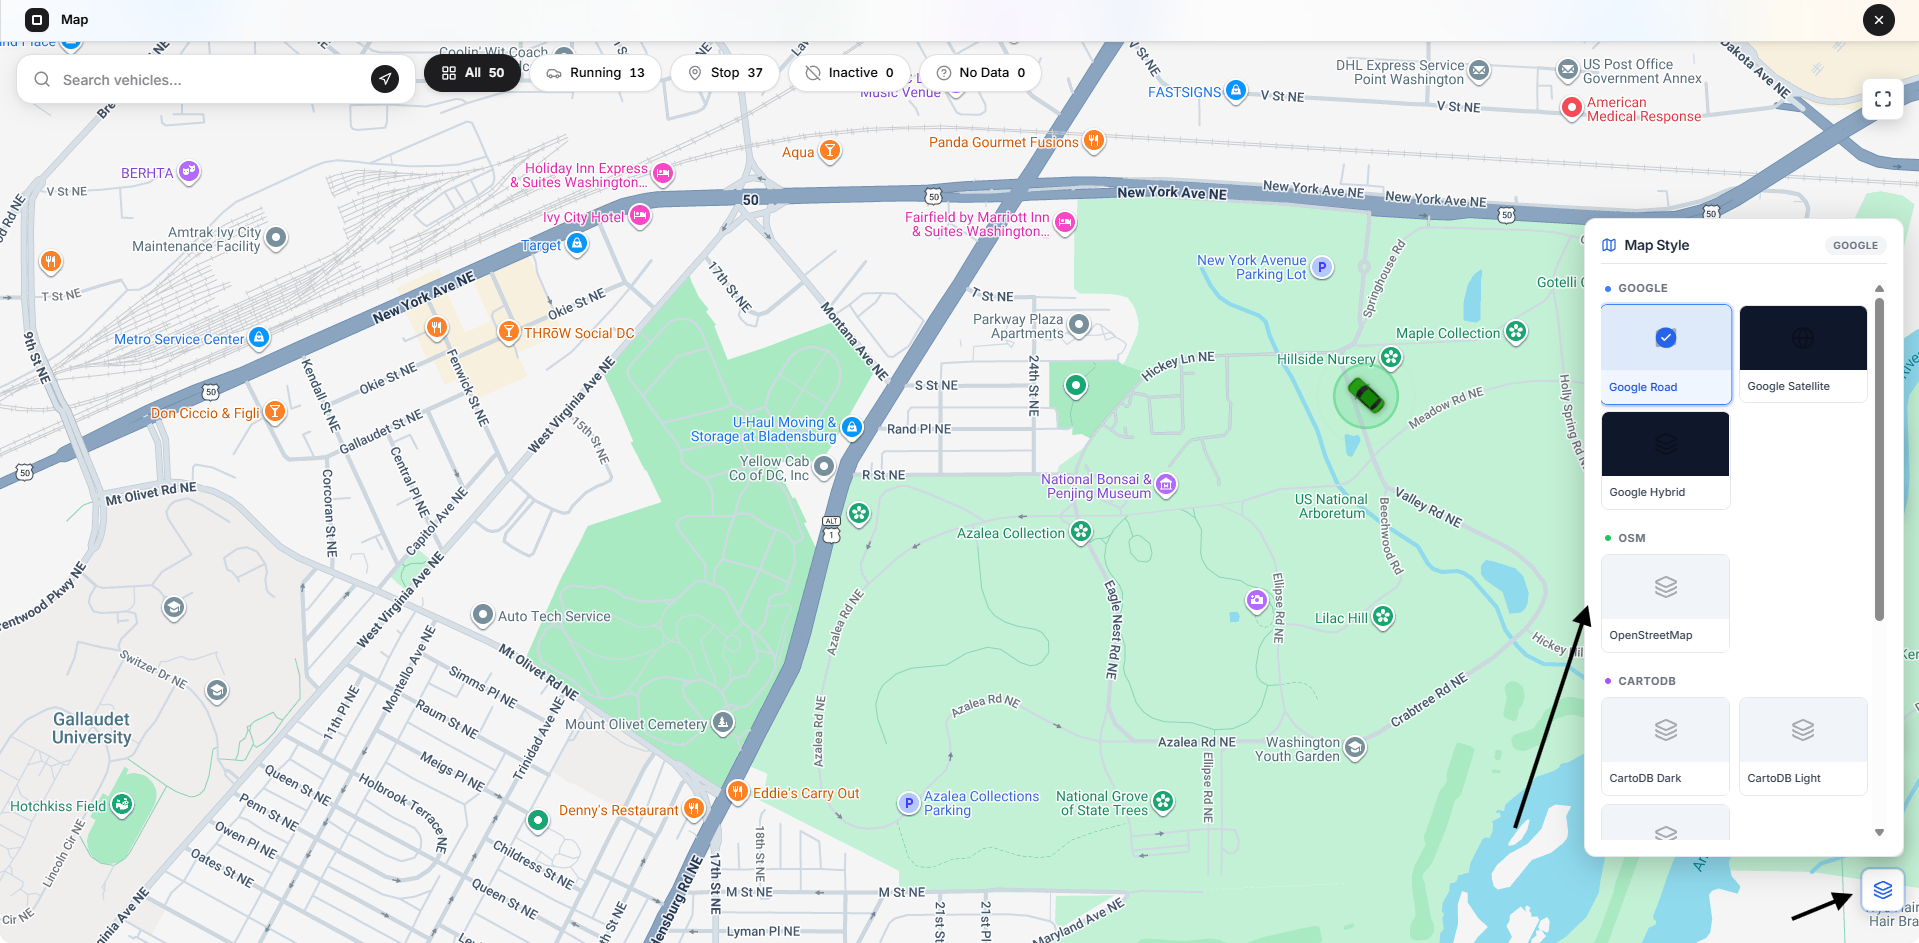
The selected basemap appears behind all vehicle markers and operational overlays.
Changing Map Style does not change GPS data or vehicle positions.
The configured basemaps are:
- Google Road
- Google Satellite
- Google Hybrid
OpenStreetMap
- OpenStreetMap
CartoDB
- CartoDB Dark
- CartoDB Light
- CartoDB Voyager
Esri
- Esri Satellite
- Esri Topographic
Stamen
- Stamen Toner
- Stamen Watercolor
The panel is scrollable because not all styles fit in the visible area at once.
Choosing a Basemap
Road Maps
Use Google Road or OpenStreetMap for normal fleet monitoring and road-based operations.
Satellite Maps
Use Google Satellite or Esri Satellite to inspect:
- Physical buildings
- Industrial areas
- Open land
- Rural roads
- Construction areas
Hybrid
Google Hybrid combines satellite imagery with labels and roads.
Light Maps
CartoDB Light provides a less visually crowded background.
Dark Maps
CartoDB Dark can improve visibility in dark environments.
Topographic Maps
Esri Topographic provides terrain and geographic context.
Map availability and imagery detail depend on the selected map provider.
Feature Interactions
Several Map features use the same visual area and are intentionally prevented from overlapping.
Show Path and History
Starting Show Path clears active History.
Starting History clears Show Path.
Show Path and Replay
Starting Show Path stops Replay.
Starting Replay clears Show Path.
History and Replay
Replay has visual priority over History.
While Replay is active, the History route is hidden.
The History panel also warns when Replay is active and prevents a new History request until Replay is cleared.
Vehicle Selection
Changing the selected vehicle clears the previous vehicle’s Show Path.
Closing the selected vehicle closes the live HUD and Vehicle Details panel.
Alerts
Selecting an alert selects its associated vehicle and opens the vehicle context.
Overlays
Geofence, POI, and saved Route overlays can remain enabled while viewing normal live markers.
History, Replay, and Show Path are separate telemetry route modes and should be used one at a time.
License-Restricted Vehicles
A license-restricted vehicle can remain visible in the vehicle list with a License Required indication.
When selected, the Vehicle Details panel displays a licensing warning.
The following actions are disabled:
- Show Path
- StreetView
- Send Command
Licensing status does not replace stored vehicle data, but it can restrict operational features.
Empty and Error States
No Vehicles
The Vehicles tab displays an empty state when no records are available or the current search finds no match.
No Valid Coordinates
The vehicle may appear in the list without appearing as a marker.
No Telemetry
The vehicle can display inactive or no-data information with unavailable speed and distance.
No Logs
The Logs table displays No logs available.
Incomplete Custom Logs Range
The Logs tab asks for both start and end date and time.
No Replay Data
Replay displays a no-data message and does not open the timeline.
No History Data
History displays a no-data error and leaves the route overlay closed.
No Alerts
The Alerts tab displays No alerts found and an operational empty state.
No Events
The Events tab displays its no-events state.
No Sensors
The Sensors tab shows that sensors have not been configured.
Address Unavailable
The Map continues to use coordinates even when reverse geocoding cannot provide a readable address.
Large-Fleet Operation
The Superadmin Map is designed to handle fleets that can contain thousands of vehicles.
Its large-fleet behaviour includes:
- Progressive telemetry loading
- Cursor-based data pages
- Batched live telemetry
- Incremental marker updates
- Status recalculation without complete reload
- Optional marker clustering
- Selected-marker isolation
- Cached addresses
- Paginated Logs and Events
- Point limits for Show Path and Replay
- Configurable History date limits
Recommended Working Method
For a large fleet:
- Keep Cluster enabled.
- Use status filters before manually scanning markers.
- Search by vehicle or IMEI.
- Use Fit All Vehicles only when a platform-wide view is required.
- Use shorter History and Replay periods for detailed investigations.
- Clear completed route modes before beginning another analysis.
- Keep Vehicle Label disabled at wide zoom levels.
- Disable Ripple Effect when many vehicles are moving at once.
Large-Fleet Testing
When testing the Map with virtual vehicles, verify:
- Total vehicle counts
- Progressive marker loading
- Vehicle search response time
- Status-filter response time
- Marker movement smoothness
- Cluster creation and expansion
- Vehicle selection
- Live HUD accuracy
- Dock-panel opening time
- Logs stream stability
- Replay loading and playback
- History calculation time
- Alert delivery
- Browser memory usage
- CPU usage
- Behaviour when thousands of vehicles update simultaneously
- Behaviour when coordinates are identical
- Behaviour when devices stop sending data
- Recovery after socket reconnection
Testing should include:
- Small fleets
- Several hundred vehicles
- Several thousand vehicles
- Large bursts of telemetry
- Vehicles distributed globally
- Many vehicles concentrated in one area
- Mixed active, stopped, inactive, and no-data states
Operational Best Practices
- Use the Vehicles tab for live operational monitoring.
- Use Logs for packet-level investigation.
- Use Replay for time-based visual playback.
- Use History for route analytics and segment review.
- Use Alerts for platform-wide exception monitoring.
- Use Events for the selected vehicle’s event feed.
- Use Show Path for a quick view of the current day.
- Use StreetView only when environmental context is required.
- Confirm commands carefully before sending.
- Use saved Route overlays for planned journeys, not as proof of actual travel.
- Keep Map Settings appropriate for the fleet size.
- Clear route modes after completing an investigation.
Security and Privacy
The Superadmin Map can expose sensitive operational information.
Before publishing screenshots, recordings, or documentation, hide or replace:
- IMEI numbers
- SIM numbers
- Vehicle numbers
- Plate numbers
- VINs
- Exact live locations
- Addresses
- User names
- Administrator names
- Raw device packets
- Command payloads
- Device responses
- Geofence names
- Customer routes
- Event messages
- Exported telemetry
Do not share a live vehicle location publicly without authorization.
Command screenshots should use safe, non-destructive examples.
Next Step
Continue to Superadmin Calendar to review scheduled and date-based platform activity.
For vehicle creation and detailed fleet configuration, open the relevant Administrator workspace and use its Vehicle Management module.